跳转至内容

尊敬的客户:

目前国际形势复杂多变,关税政策尚不明朗,这可能对我们的产品价格产生一定影响。在此情况下,我们希望就订单事宜与您进行友好沟通。

基于当前的不确定性,如果您选择在此期间下单,我们将保留根据实际情况调整价格的权利。同时,我们也理解市场变化可能给您带来的困扰,因此如果在订单实际发货前因关税政策变动导致价格出现较大波动,默克将与您进行协商讨论并视情况对订单进行调整或取消。

关于应对近期政策变化的重要更新,请点击此处查看详情。

Merck
CN
HomeSmall Molecules Analysis & QCHPLC Separation of Nitrosamines with Supel Carbon LC

HPLC Separation of Nitrosamines with SupelTM Carbon LC

Eddy Tan, Associate Senior Scientist

R&D APAC Lab Singapore

Abstract

The SupelTM Carbon LC column is used for the separation of six nitrosamine compounds. This method is a reversed phase gradient separation of the nitrosamines for identification and quantification.

  • Introduction
  • Experimental
  • Results and Discussion
  • Conclusion
  • Introduction

    Nitrosamines have been known to exist in the environment and within food sources1, 2 with awareness further raised in 2018 when many regulatory authorities for medicines became aware of the dangers of N-Nitrosamines as drug contaminants.3 This class of compounds is known to be potent carcinogens4 and can be introduced through multiple introduction pathways.5 In this application, 2.7 µm porous graphitic carbon particles in SupelTM Carbon LC column are used to separate six different nitrosamines followed by UV detection.

    Experimental

    For this study, the following procedures and conditions were used:

    Mobile Phase Preparation

    • Water + 0.1% trifluoroacetic acid (TFA): Add 100 µL of TFA to 100 mL of water.
    • Acetonitrile + 0.1% TFA: Add 100 µL of TFA to 100 mL of acetonitrile, add trifluoroacetic acid

    HPLC Parameters


    Column:

    SupelTM Carbon LC, 2.7 µm, 100 x 3.0 mm I.D. (59993-U)

    Mobile phase:

    [A] Water + 0.1% TFA, [B] Acetonitrile + 0.1% TFA

    Gradient:

    Time (min)

    % B

    0.00

    2.5

    0.50

    2.5

    5.00

    95.0

    7.00

    95.0

    7.01

    2.5

    10.00

    2.5

    Flow Rate

    0.5 mL/min

    Pressure:

    80 – 130 bar

    Column temp:

    90 oC

    Detector:

    UV, 230 nm

    Injection:

    5 µL

    Samples:

    Standard solution (see below)

    Table 1.HPLC Conditions used for nitrosamine determination

    Nitrosamine Standard Solutions for Linearity, LOD and LOQ Determination

    NMBA, NEIPA, NDIPA, NDBA and NMPA

    • For NMBA, NEIPA, NDIPA, NDBA and NMPA (standard concentration ~1000 mg/L), transfer 400 µL into a 5 mL volumetric flask.
    • Top-up to mark with mobile phase A (water + 0.1% TFA) and mix well. Sonicate for 10 min. This solution is the main working standard (~80 mg/L).
    • Dilute to approximately 5, 10, 20, 40, 60 mg/L with mobile phase A in 5 mL volumetric flasks based on serial dilution. (True concentrations for linearity are based on batch CoA of reference materials used.)

    NDEA

    • For NDEA (Neat liquid ~99.8 % purity), weigh ~50 mg of NDEA CRM into a 5 mL volumetric flask.
    • Top-up to mark with acetonitrile and mix well. Sonicate for 10 min. This solution is the stock solution (~10,000 mg/L).
    • Dilute to approximately 5, 10, 20, 40, 60, 80 mg/L with mobile phase A in 5 mL volumetric flasks based on serial dilution. (True concentrations for linearity is based on batch CoA of reference material used.)

    Linearity data is obtained from linear regression, LOD and LOQ values are calculated based on USP.

    Results & Discussion

    The analysis of the standard mix containing six nitrosamine impurities (NDEA, NMBA, NEIPA, NDIPA, NDBA, NMPA) at 20 mg/mL each is shown in Figure 1. The chromatographic data for the analysis of the standard mix is listed in Table 2. All peaks are base line separated.
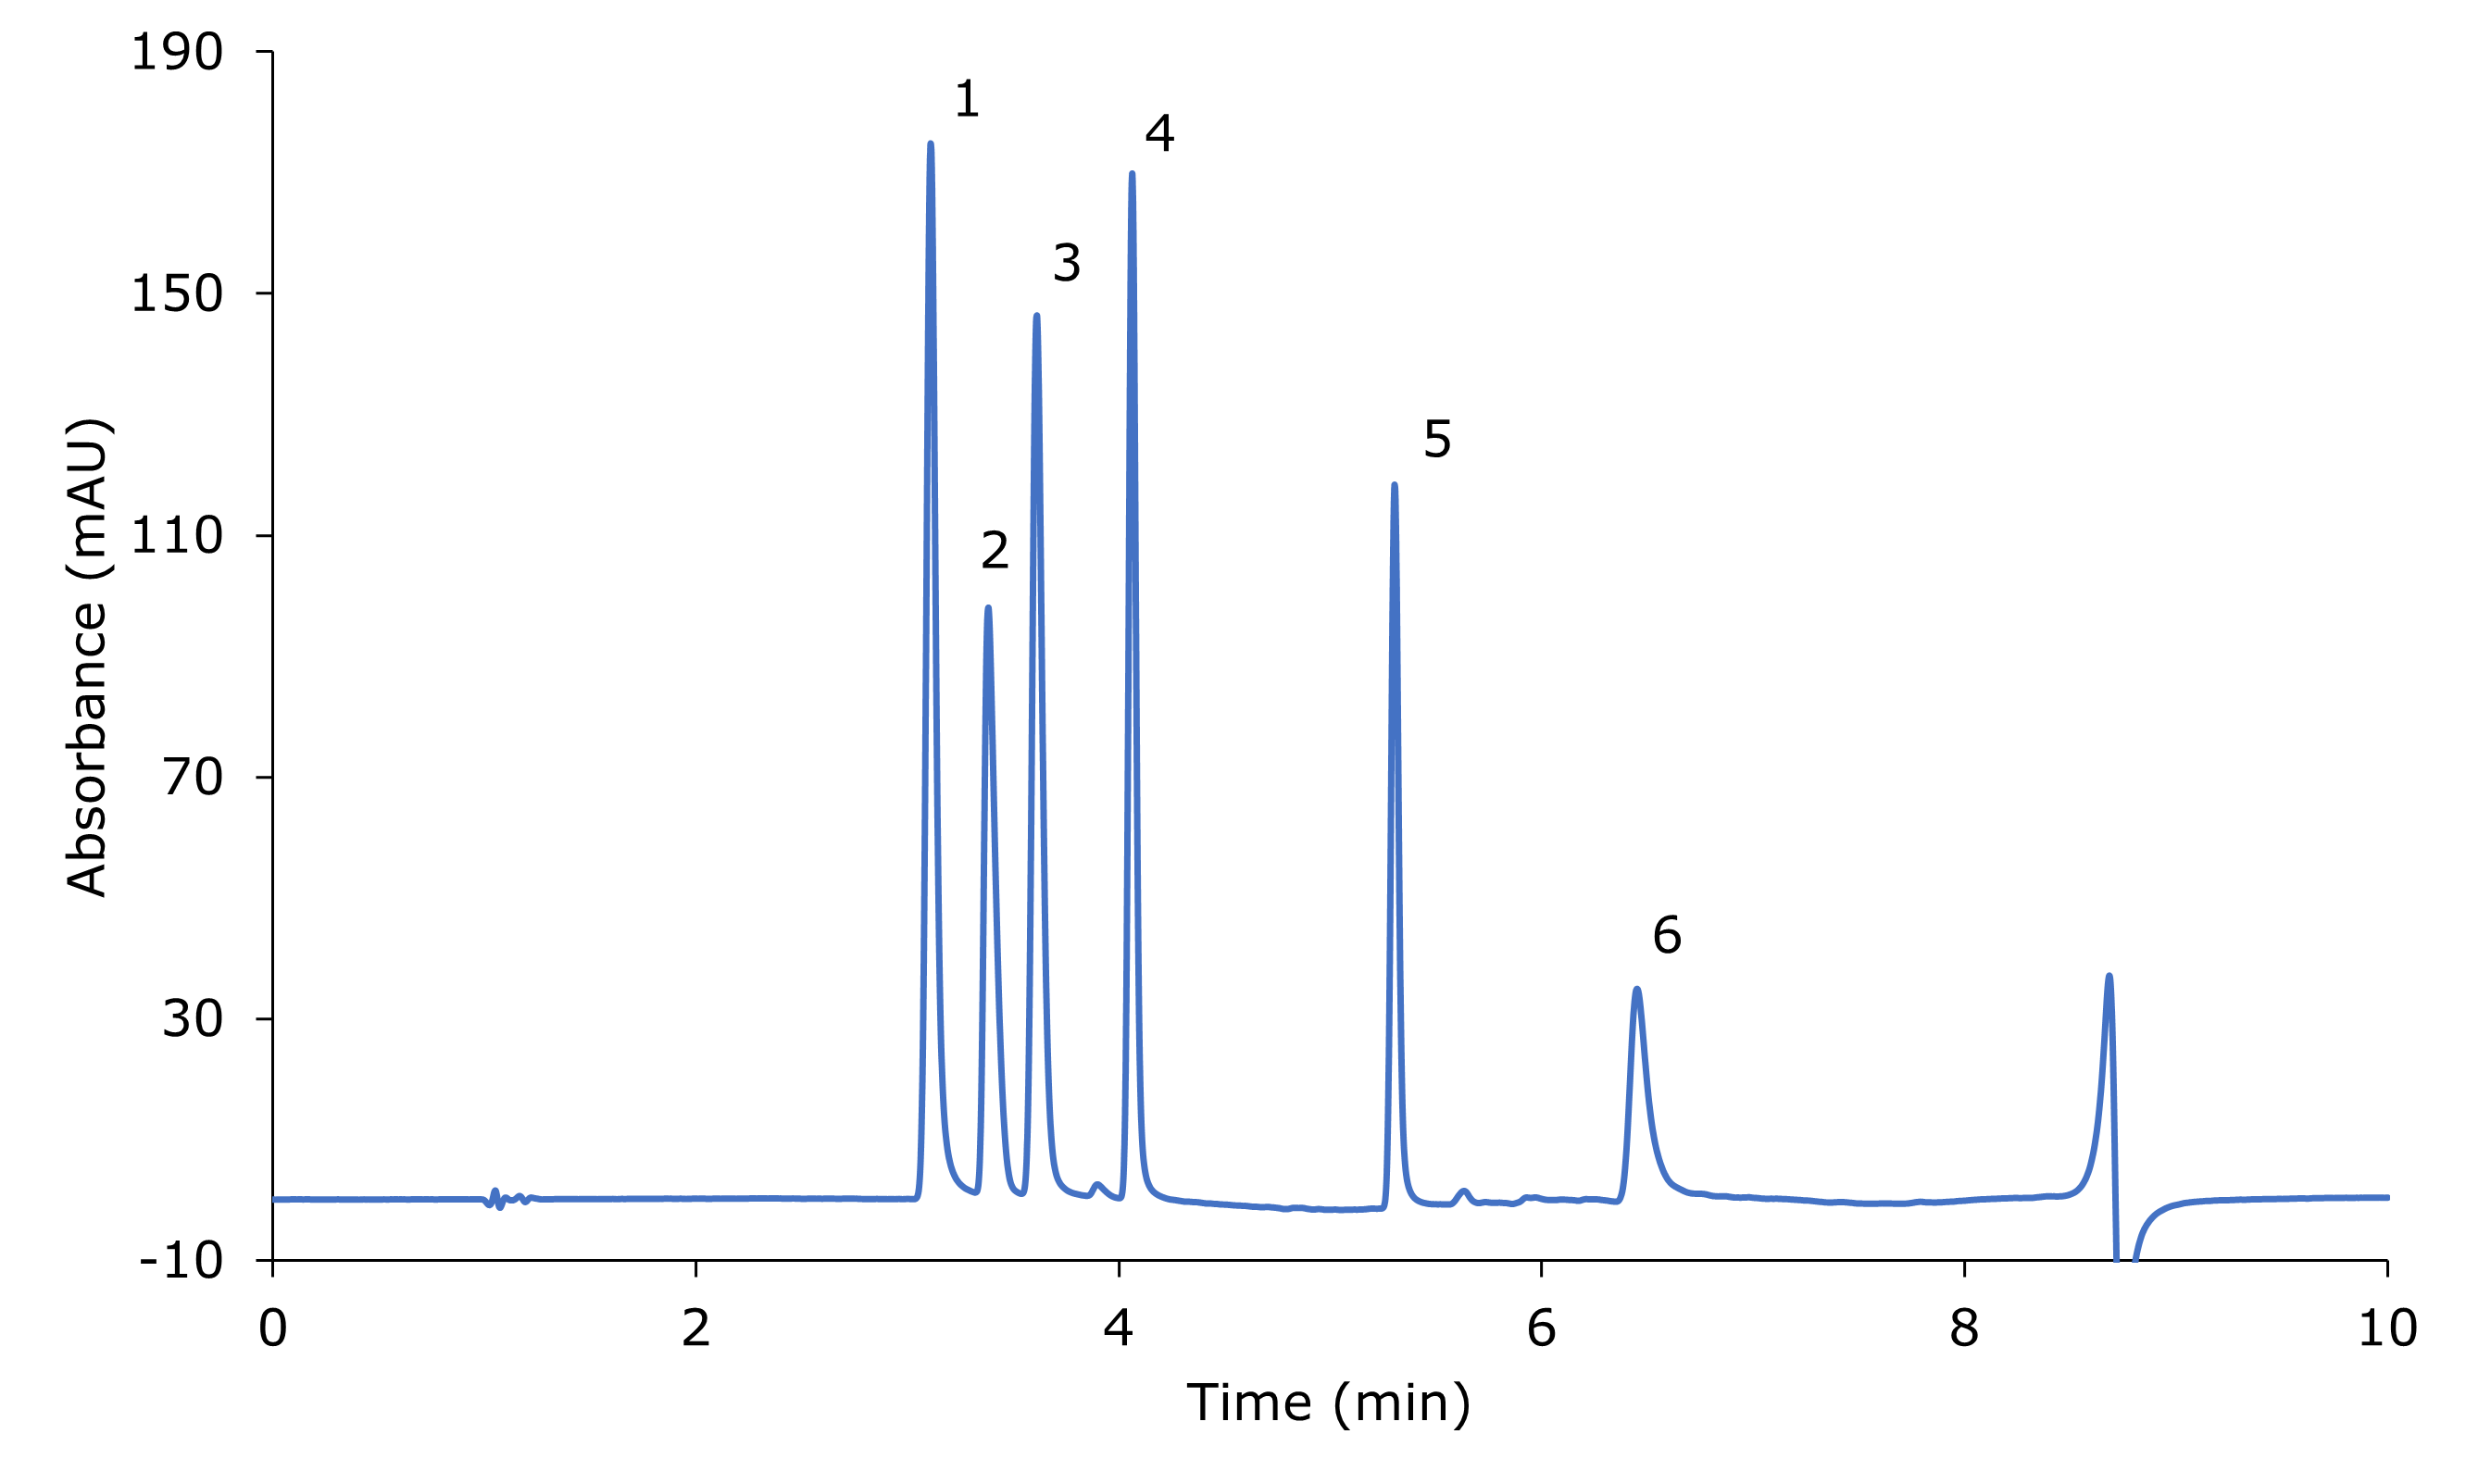
    An HPLC-UV chromatogram illustrating the separation of nitrosamine impurities, including NDEA, NMBA, NEIPA, NDIPA, NDBA, and NMPA. Six distinct green-colored peaks, labeled 1, 2, 3, 4, 5, and 6, are visible on the plot. These peaks were obtained from the analysis of a standard mix, each at a concentration of approximately 20 mg/L.

    Figure 1.Separation of six nitrosamines standard mix (~20 mg/L each); blank subtracted chromatogram. 1: NDEA, 2: NMBA, 3: NEIPA, 4: NDIPA, 5: NDBA, 6: NMPA.

    Peak no.

    Compound

    Retention time (min)

    *Asymmetry (USP)

    *Resolution (USP)

    1

    N-Nitrosodiethylamine (NDEA)

    3.1

    1.34

    2.92

    2

    N-Nitroso-N-methyl-4-aminobutyric acid (NMBA)

    3.4

    1.59

    2.36

    3

    N-Nitrosoethylisopropylamine (NEIPA)

    3.6

    1.26

    5.80

    4

    N-Nitrosodiisopropylamine (NDIPA)

    4.1

    1.16

    18.95

    5

    N-Nitrosodibutylamine (NDBA)

    5.3

    1.19

    10.69

    6

    N-Nitrosomethylphenylamine (NMPA)

    6.5

    1.54

    -

    *Asymmetry and resolution values were generated from Chromeleon® 7 CDS software.

    Table 2.Nitrosamines retention time, resolution and asymmetry for a standard with ~20 mg/L each compound

    Calibration

    The calibration data summary and combined limits of detection (LOD) and limits of quantification (LOQ) of the applied method for the six nitrosamines (NDEA, NMBA, NEIPA, NDIPA, NDBA, NMPA) are listed in Table 3. All six nitrosamines exhibited excellent linear regression of more than 0.99. LOD and LOQ of these nitrosamines are found to be in low mg/L range when using UV detection.

    Peak

    Compound

    Calibration range (mg/L)

    No. of calibrators

    R2

    LOD (mg/L)

    LOQ (mg/L)

    1

    N-Nitrosodiethylamine (NDEA)

    11.03 - 88.24

    5

    0.9998

    1.58

    4.79

    2

    N-Nitroso-N-methyl-4-aminobutyric acid (NMBA)

    4.76 - 57.16

    5

    0.9999

    0.73

    2.21

    3

    N-Nitrosoethylisopropylamine (NEIPA)

    10.51 - 84.02

    5

    0.9961

    7.18

    21.75

    4

    N-Nitrosodiisopropylamine (NDIPA)

    5.00 - 60.00

    5

    0.9998

    1.18

    3.56

    5

    N-Nitrosodibutylamine (NDBA)

    4.96 – 59.46

    5

    1.0000

    0.41

    1.25

    6

    N-Nitrosomethylphenylamine (NMPA)

    9.48 - 75.79

    5

    0.9996

    2.13

    6.46

    Table 3.Calibration data summary and Limits of detection (LOD) and limits of quantification (LOQ) for the six nitrosamines

    Conclusion

    The SupelTM Carbon LC column is able to separate six nitrosamines based on reversed phase with good reproducibility for repeated analyses (data not shown here). The resolution and peak asymmetry for the six different nitrosamines are greater than 1.5 and less than 2.0 respectively. LOD and LOQ of the tested nitrosamines are in the low mg/L range and can be further improved with the use of mass spectrometry instrumentation.

    References

    1.
    Robles H. 2014. Nitrosamines. Encyclopedia of Toxicology (Third Edition). Academic Press.584-585. https://doi.org/10.1016/b978-0-12-386454-3.00523-6
    2.
    Gushgari AJ, Halden RU. 2018. Critical review of major sources of human exposure to N-nitrosamines. Chemosphere. 210:1124-1136. https://doi.org/10.1016/j.chemosphere.2018.07.098
    3.
    Center for Drug Evaluation, Research. FDA updates and press announcements on angiotensin II receptor blocker (ARB) recalls (valsartan, losartan, and irbesartan) . [Internet]. U.S. Food and Drug Administration. 2023 Aug 23 .[cited 31 Aug 2023]. Available from: https://www.fda.gov/drugs/drug-safety-and-availability/fda-updates-and-press-announcements-angiotensin-ii-receptor-blocker-arb-recalls-valsartan-losartan
    4.
    Information note for nitrosamine impurities. 2019. [Internet]. World Health Organization. Available from: https://www.who.int/news/item/20-11-2019-information-note-nitrosamine-impurities
    5.
    USP General Chapter <1469> Nitrosamine Impurities. https://doi.org/10.31003/uspnf_m15715_02_01
    登录以继续。

    如要继续阅读,请登录或创建帐户。

    暂无帐户?