跳转至内容

很抱歉,目前系统维护中。在此期间,网站下单功能无法使用。给您带来不便,深表歉意。如需其他帮助,请联系客户联络中心:400 620 3333。

Merck
CN
HomeSmall Molecule HPLCAnalysis of 20 Underivatized Amino Acids

LC-MS/MS Analysis of Underivatized Amino Acids on Supel Carbon LC Column

Amino acids are the building blocks of proteins and peptides in biological systems. Amino acids have also been used as supplements to support health and as indicators for certain diseases. The challenge with amino acids analysis lies in the wide- ranging polarities across all 20 amino acids (Figure 1). Due to this complexity, amino acid analysis methods in the past have relied on derivatization of amino acids; however, derivatization can lead to further complexity due to the presence of derivatized/underivatized amino acids and interferences from the derivatizing reagent itself.

This application outlines an LC-MS/MS method (Table 1) for analyzing all 20 amino acids, without derivatization, utilizing the Supel Carbon LC column. All 20 amino acids are retained on the column under reversed phase conditions, with good peak shape.

Read more:
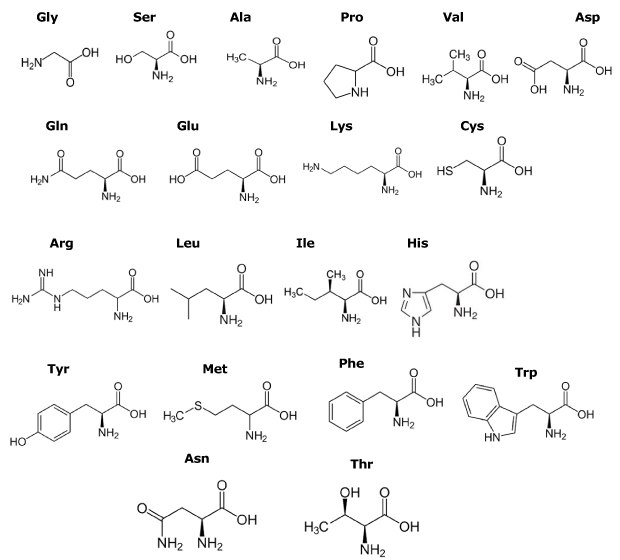
Chemical structures of 20 amino acids are presented in 5 rows, each with their three-letter codes. The first row displays Gly, Ser, Ala, Pro, Val, and Asp from left to right. The second row shows Gln, Glu, Lys, and Cys. The third row includes Arg, Leu, Ile, and His. The fourth row features Tyr, Met, Phe, and Trp. The fifth and final row has Asn on the left and Thr on the right.

Figure 1.Structures and three letter codes of amino acids.
Experimental

LC Conditions


Column:

Supel Carbon LC, 2.7 µm, 10 cm x 2.1 mm I.D. (59986-U)

Mobile phase:

[A] Water (0.1% (v/v) DFA);

[B] Acetonitrile (0.1% (v/v) DFA)

Gradient:

Hold at 0% B for 7 min; 0% B to 5% B in 5 min; 5% B to 100% B in 10 min  

Flow rate:

0.2 mL/min

Column temp.:

12 °C

Detector:

MSD, ESI(+), MRM (Table 2 & 3)

Injection:

1.0 μL

Sample:

Amino Acid Mix, varied concentrations (Table 4) in water (0.1% (v/v) DFA)

Table 1.LC Conditions used for analysis of underivatized amino acids

Ion Source Type:

Turbo Spray

Polarity:

ESI(+)

Curtain Gas:

25

Ion Spray Voltage:

4000 V

Temperature:

300 °C

Ion Source Gas 1:

20

Ion Source Gas 2:

30

Interface Heater:

On

Table 2.MS conditions for the detection of amino acids

Name

Q1

Q3

DP

EP

CEP

CE

CXP

Lysine

147.1

84.0

21.7

7.0

5.3

21.0

3.0

Proline

116.1

70.1

22.2

7.9

6.2

19.1

4.1

Aspartic Acid

134.1

74.0

17.0

8.3

12.8

17.0

3.7

Serine

106.1

60.0

13.0

4.0

8.8

15.0

3.1

Glycine

76.1

30.0

7.0

7.0

4.9

17.0

5.5

Alanine

90.1

44.0

16.0

6.0

4.9

16.9

5.6

Threonine

120.1

56.0

19.0

5.3

7.0

22.0

3.3

Asparagine

133.1

87.0

17.0

3.3

8.2

14.0

2.6

Valine

118.1

72.0

14.5

6.0

7.5

14.0

3.2

Glutamine

147.1

84.0

12.0

6.8

6.1

23.0

3.5

Leucine

132.1

86.0

16.0

7.4

10.2

14.0

3.2

Glutamic Acid

148.1

84.0

24.0

6.1

9.0

20.0

3.0

Isoleucine

132.1

86.0

16.0

7.4

10.2

14.0

3.2

Methionine

150.2

104.0

16.0

5.5

11.8

13.6

3.9

Histidine

156.1

110.0

24.0

3.5

11.0

19.0

3.7

Arginine

175.2

70.0

25.2

6.7

10.0

37.7

3.0

Phenylalanine

166.2

120.2

18.0

7.0

9.1

16.8

3.2

Tryptophan

205.2

146.2

19.4

4.8

17.7

23.0

4.0

Tyrosine

182.2

136.2

19.2

7.7

6.4

18.04

4.0

Cystine

241.2

120.0

26.0

7.8

9.8

26.0

4.1

Table 3.MRM fragmentation parameters and ions used for the 20 amino acids

Results

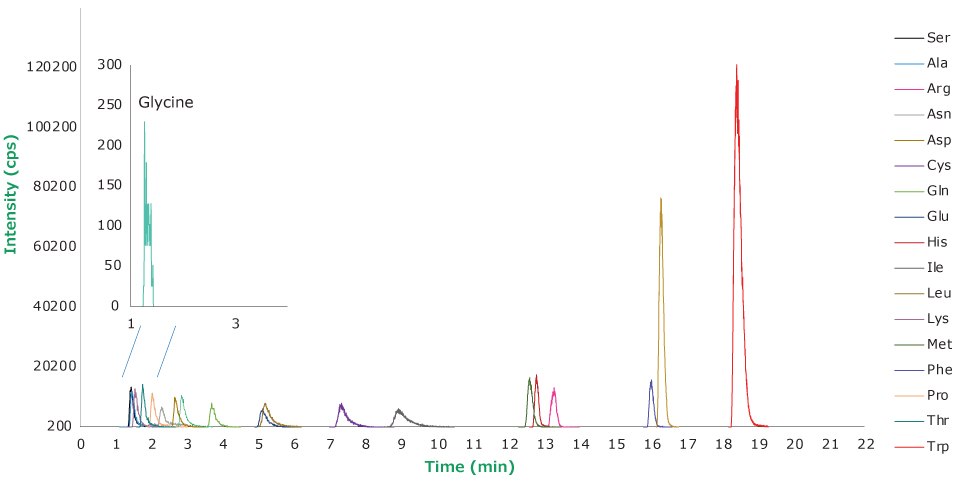
Figure 2 displays the MS spectral results for the analysis of 20 underivatized amino acids while Table 2 displays the optimized MS conditions for the separation, and Table 3 displays the fragment ions and fragmentation parameters for the amino acids.

A plot with intensity on the y-axis and time in minutes on the x-axis shows separated peaks for 20 underivatized amino acids of varying heights. The x-axis ranges from 1 to 22 minutes in 1-minute intervals, and the y-axis has major tick marks at 20,200, 40,200, 60,200, 80,200, 100,200, and 120,200. The top left shows a blown up version of the chromatogram measured between 1 to 3 minutes showing a clear peak for the amino acid glycine in purple color.

Figure 2.Separation of 20 underivatized amino acids by LC-MS/MS at various concentrations (Table 4).

Peak

Compound

Concentration (μg/mL)

Retention Time (min)

1

Glycine

20

1.27

2

Serine

2

1.43

3

Alanine

2

1.45

4

Lysine

1.5

1.54

5

Threonine

2

1.75

6

Proline

0.5

2.03

7

Asparagine

2.5

2.29

8

Aspartic Acid

2.5

2.65

9

Valine

0.5

2.85

10

Glutamine

1.5

3.69

11

Glutamic Acid

1

5.13

12

Leucine

0.5

5.18

13

Cystine

7.5

7.34

14

Isoleucine

0.75

8.93

15

Methionine

1.5

12.61

16

Histidine

0.5

12.81

17

Arginine

1.5

13.30

18

Phenylalanine

0.25

16.03

19

Tyrosine

5

16.29

20

Tryptophan

5

18.42

Table 4.Twenty underivatized amino acids determined by LC/MS - Elution order, concentrations and retention times

Conclusion

This application demonstrated the effectiveness of the Supel Carbon LC column in the resolution of amino acids without the need for a derivatization reagent. Qualitative analysis of amino acids is typically done with specialty, silica-based columns, ion exchange columns, or normal phase columns. However, by utilizing tandem MS/ MS detection, analyses of amino acids can be accomplished on Supel Carbon LC column with fast run times compared to most commercial approaches. Due to porous graphitic carbon’s unique ability to discriminate three- dimensional differences between compounds, leucine and isoleucine can be resolved with exceptional resolution

Related Products
产品编号产品名称说明价格
登录以继续。

如要继续阅读,请登录或创建帐户。

暂无帐户?