T-Cell Migration Assays Using Millicell® Cell Culture Inserts
- What is Cell Migration?
- What do I need to perform Cellular Migration Assay with Suspension Cells?
- Cell Seeding Protocol
- Cell Migration Assay Protocol
- Analysis of Migrated Cells
- Sample Results and Data Analysis
What is Cell Migration?
Cellular migration is the purposeful movement of cells in response to a mechanical or a chemical stimulus, also known as a chemoattractant. Signaling proteins in cells secrete chemoattractants to attract immune cells to the sites of disease or infection. Understanding how chemokine-immune cell interactions help mount a host response is crucial for developing therapeutics against diseases such as cancer.
In 1962, the first Boyden chamber was developed with Millipore membranes to study leukocyte migration to anti-serum1. Today, Millicell® cell culture inserts can be utilized to study T-cell migration towards chemokines. Here we focus on the interaction of CXCR4 on the T-cell receptor and CXCL12/SDF1 chemokine.
This protocol demonstrates how to perform a cell migration assay with two suspension T-cell lines of varying sizes: Jurkat E6.1 and primary CD4+ cells. The suspension cells were quantified by colorimetric and flow cytometry assays, respectively. Membrane pore size, cell seeding density, and chemoattractant concentration were varied in sample results to demonstrate optimized assay conditions. Our data indicates that for cell migration assays, the 8.0 µm Millicell® hanging cell culture insert is optimal pore size for Jurkat cells, whereas the 5.0 µm Millicell® hanging cell culture insert is optimal for primary CD4+ cells.
Cell Seeding Protocol
Jurkat E6.1 cells
- Culture Jurkat E6.1 cells in a T-150 cell culture flask with complete RPMI-1640 media supplemented with 10% fetal bovine serum (FBS), 1x-L-glutamine, and 1x penicillin-streptomycin.
- When Jurkat cells are 80% confluent, harvest cell solution into a 50 mL conical tube.
- Spin down cells into a pellet at 300 x g for 3 minutes and resuspend the pellet into fresh RPMI-1640 media with no FBS. Repeat twice to remove residual FBS.
Note: FBS can act as a chemoattractant and interfere with chemoattractant signal. Wash steps can be performed either with media (no FBS) or in Phosphate Buffer Saline Solution (PBS).
- Count cells using trypan blue exclusion method to calculate live cells. Prepare respective cell solutions with appropriate seeding densities in RPMI-1640 media without FBS.
Note: For this protocol, seeding densities were 2x10⁶, 1x10⁶, and 0.5x10⁶ Jurkat cells per 200 µL to optimize seeding density for the T-cell migration assay.
- Measure average cell diameter using the Scepter™ 3.0 Handheld Automated Cell Counter.
Optional: Use the Millicell® DCI Digital Cell Imager to observe cell morphology.
Frozen Human Normal CD4+ Helper T Cells
- Carefully thaw Human CD4+ (T Cells) vial in a 37°C water bath for approximately 1-2 minutes.
- Slowly add 1 mL of pre-warmed RPMI-1640 media without FBS to the vial.
- Transfer the cell solution (approximately 2 mL) from the vial to a 50 mL conical tube. Slowly add 18 mL of RPMI-1640 media without FBS to the tube.
- Centrifuge the tube at 200 x g for 15 minutes.
- Carefully aspirate media, leaving the cell pellet in the conical tube and resuspend pellet in RPMI-1640 media without FBS. Repeat twice to remove residual FBS.
Note: FBS can act as a chemoattractant and interfere with chemoattractant signal. Wash steps can be performed either with media (no FBS) or in Phosphate Buffer Saline Solution (PBS).
- Perform cell counting using trypan blue exclusion method to calculate live cells. Prepare respective cell solution with 1x10⁶ cells per 200 µL in RPMI-1640 media without FBS.
- Measure average cell diameter using the Scepter™ 3.0 Handheld Automated Cell Counter.
Optional: Use the Millicell® DCI Digital Cell Imager to observe cell morphology.
CELL MIGRATION ASSAY PROTOCOL
Note: It is important to select a membrane pore size that will inhibit passive migration but allow active migration. The Scepter™ 3.0 Handheld Automated Cell Counter is a convenient tool to quickly measure cell diameter. If the pore size is too large, cells will passively migrate through the pores. However, if the pore size is too small, cells will be physically inhibited from migrating toward the chemoattractant.
- Place Millicell® hanging inserts in a cell culture plate, ensuring that the flanges are flat and directly resting on the top of the well.
Optional: Add pre-warmed RPMI-1640 media without FBS to the insert and place into incubator for several minutes. After, vacuum aspirate the media.
- Prepare chemoattractant at respective concentrations in RPMI-1640 with no FBS. This protocol utilized CXCL12/SDF1-α at 1 ng/mL, 10 ng/mL, and 100 ng/mL.
- Add 900 µL of the respective chemoattractant solution to the basolateral side of the inserts. Be sure to include a negative control with no chemoattractant.
- Add 200 µL of respective cell solutions to the apical side of the inserts.
- Incubate cells for 4 hours in a 37°C tissue culture incubator.
- After 4 hours, remove inserts from the plate and perform the EZ-MTT™ assay on basolateral solution.
Optional Testing: Drug-dose dependent response curve (AMD3100 vs Jurkat cells and CXCL12)
Using the optimized parameters from the migration assay, a drug-dose dependent response with AMD3100 against Jurkat and CXCL12 was tested.
- Pre-incubate Jurkat cells (2x10⁶ cells/200 µL) in RPMI media with no FBS with AMD 3100 at the respective concentrations for 30 minutes. For this assay a range of concentrations were tested: 10000, 5000, 1000, 500, 250, 100, 50, 25, 10, 5, 1, and 0 nM.
- Place 8.0 µm Millicell® inserts in a cell culture plate. Ensure the flanges are flat and directly resting on the top of the well.
- Prepare CXCL12 at 10 ng/mL in RPMI-1640 (no FBS) and add 900 µL to the basolateral side of the insert. Be sure to include negative control with no chemoattractant.
- Add 200 µL of cell solution in RPMI without FBS containing AMD3100 to the apical side of the inserts.
- After 4 hours, remove inserts from the plate and perform the EZMTT assay.
ANALYSIS OF MIGRATED CELLS
Colorimetric Read-Out with Jurkat Cells (EZ MTTTM High Sensitivity Cell Viability Assay)
- Thaw 50x EZMTT™ cell viability assay reagent on ice.
- Prepare standard cell solutions with known cell number per 900 µL of media. Aliquot 900 µL of serial cell dilution in a 24-well plate. For this assay we prepared 2-fold serial dilutions starting at 2 x 10⁶ cells.
- After 4-hour incubation, carefully remove the Millicell® inserts from the cell culture plate.
- Directly add 18 µL (final concentration 1x) of 50x EZ MTT™ High Sensitivity Cell Viability Assay reagent to the basolateral solution. Gently aspirate up and down to mix reagent into the basolateral solution containing Jurkat cells.
- Directly add 18 µL (final concentration 1x) of 50x EZ MTT™ High Sensitivity Cell Viability Assay reagent to the standard cell solutions in the 24-well plate.
Note: It is important to gently mix the basolateral solution to resuspend any cells that may have adhered to the bottom of the well.
- Incubate the plate for 1-4 hours at 37°C with 5% CO2. Gently swirl the plate every hour to ensure homogenous colorimetric reaction.
- At every hour, directly measure the absorbance at 450 nm using a microplate reader.
- Using the slope equation from the standard curve, extrapolate the number of cells from the migration assay using collected absorbance values. Then to convert to percent migration using equation below.

CD4+ Cell Counting with Flow Cytometry
- After 4 hours incubation, carefully remove the Millicell® inserts from the cell culture plate.
- Treat the cells in the basolateral solution with propidium iodide (final concentration 1 µM) for 15 minutes. This will help differentiate live versus dead cells.
- Transfer 250 µL of the basolateral solution containing the CD4+ cells into a 96-well plate.
- Add 50 µL of fluorescent calibration beads (75,000 beads per 50 µL) into the wells containing the basolateral solution. Aspirate up and down to mix the beads with the basolateral solution.
- Prepare the flow cytometry instrument following proper cleaning procedures and handling.
- Perform analysis using the Red2 fluorescence channel to view the fluorescent calibration beads, and the Red fluorescence channel to view cells stained with propidium iodide.
Note: Calibration beads are used to normalize the number events collected during flow cytometry run. Propidium iodide is used to differentiate between live and dead cells.
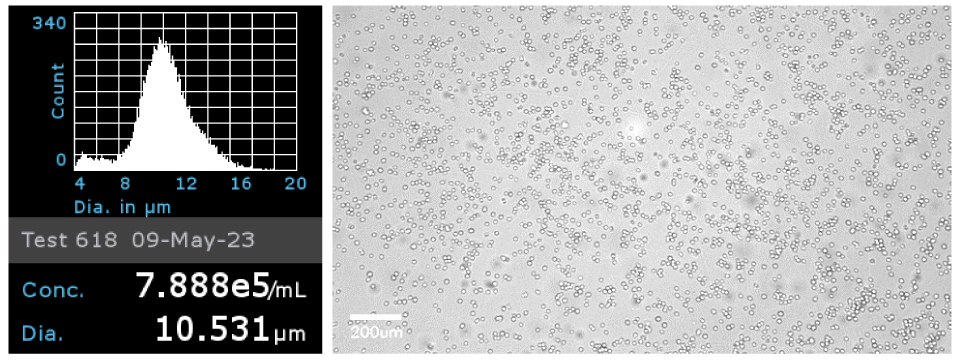
Figure 1Jurkat E6.1 cells were analyzed by ScepterTM Handheld Cell Counter with a 40 µm sensor to obtain cell concentration and cell diameter (left). Brightfield image of the Jurkat E6.1 cells on the Millicell® DCI Digital Cell Imager at 20x confirmed cell morphology (right).

Figure 2EZMTT Cell Proliferation Reagent (50x) was directly added to varying cell concentrations of Jurkat E6.1 cells. As the number of Jurkat cells increase, the MTT reagent is converted to a dark orange color that can be measured by absorbance at 450 nm (top). Using this colorimetric method, a standard curve can be generated with known cell concentrations and the slope equation can be utilized to extrapolate number of suspension cells for a migration assay.
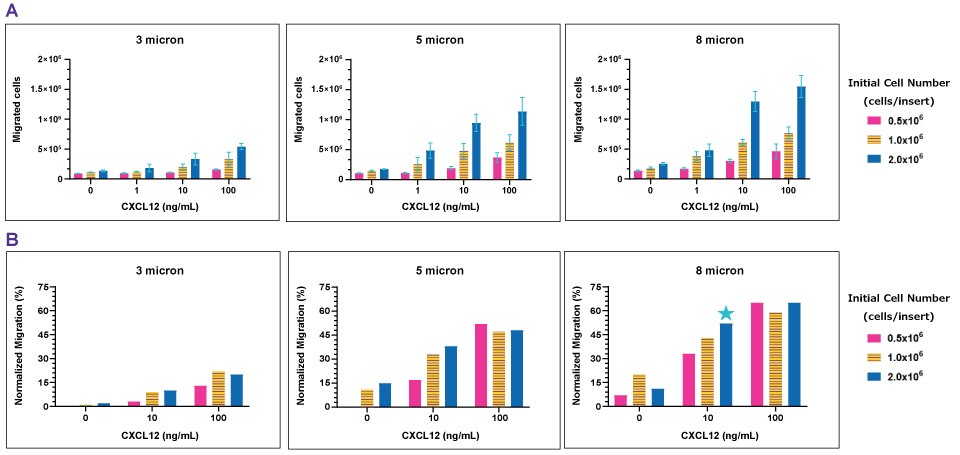
Figure 3Chemotaxis of Jurkat E6.1 to CXCL12/SDF1-α. Using the slope equation, the number of migrated cells was calculated from the respective absorbance values (A). As the initial cell number increases, the number of migrated cells increases. As the concentration of CXCL12 increases, the number of migrated cells increase. Normalized migration shows the fraction of migrated cells, excluding background migration (no chemoattractant) (B). High concentrations of CXCL12 (100 ng/mL) were excessive as all cell densities migrated at the same magnitude. Cells did not migrate (≤20%) through the 3.0 µm insert. Cells migration with the 5.0 and 8.0 µm inserts (~30-60%), the 8.0 µm inserts resulted in improved migration by ~10-15%. This result demonstrates 8.0 µm inserts would be the optimal pore size to use for a chemotaxis assay with Jurkat E6.1 cells.
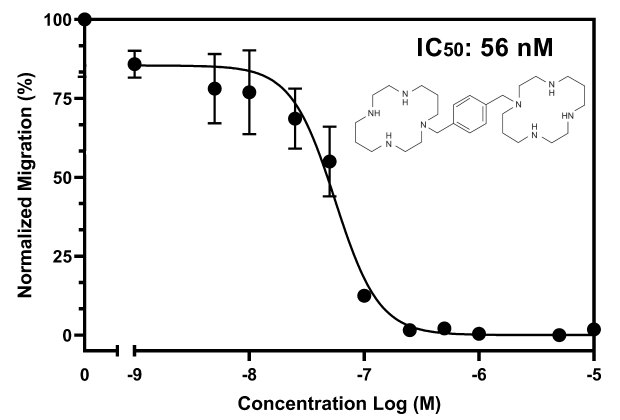
Figure 4The optimized chemotaxis parameters were utilized in a drug-dose response study, with the 8.0 µm Millicell® inserts (PTEP24H48), 2x10⁶ cells/insert, and 10 ng/mL of CXCL12. AMD3100 was added at varying concentrations to determine the inhibitory concentration (IC50) of AMD3100 against Jurkat E6.1 and CXCL12. The IC50 is 56 nM comparable to published literature2.
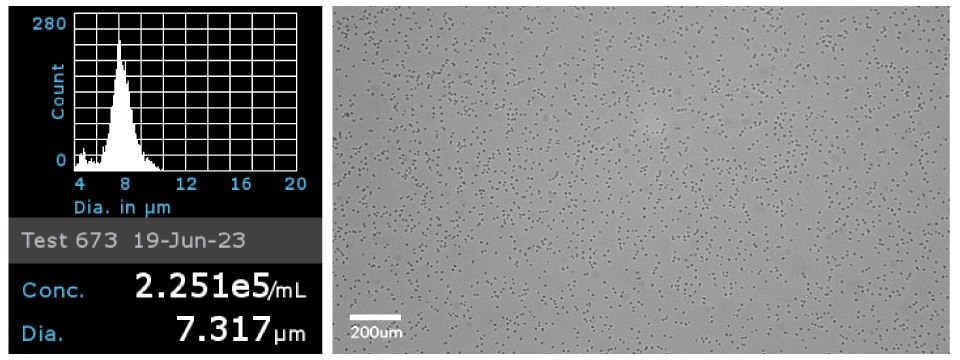
Figure 5Primary CD4+ cells were analyzed using the Scepter cell counter with 40 µm sensors to obtain cell concentration and cell diameter (left). Brightfield image of the primary CD4+ cells on the Millicell® DCI Digital Cell Imager at 20x (right).
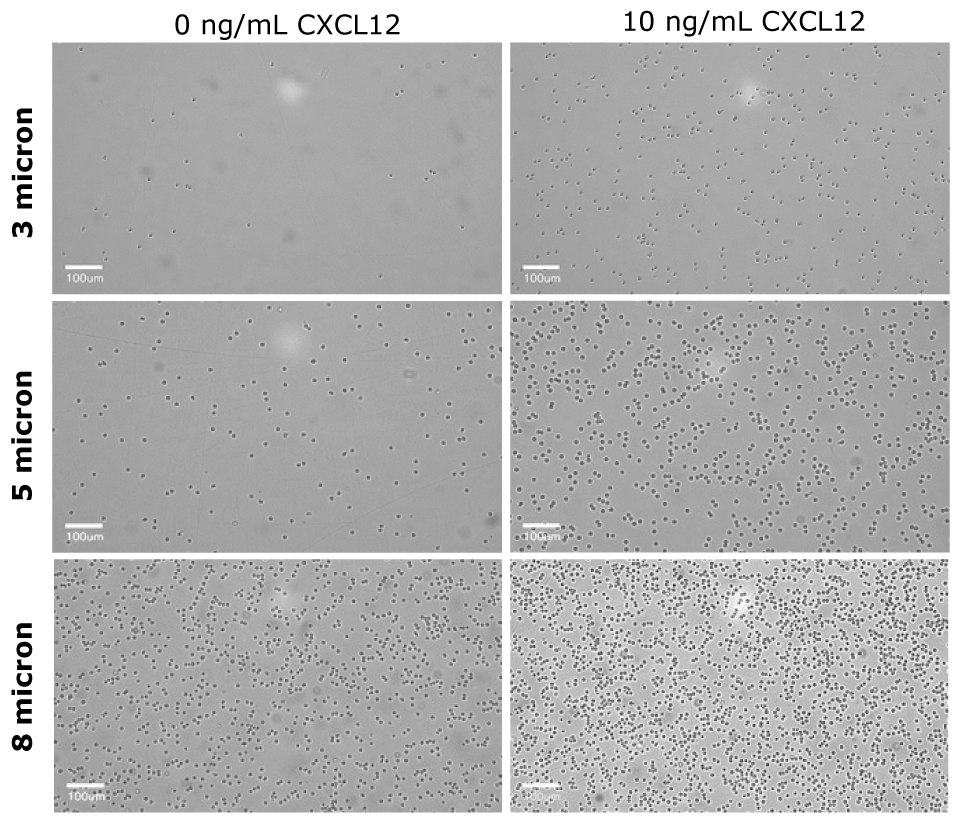
Figure 6The basolateral solution was observed under the Millicell® DCI after the migration assay. For the 3 µm insert (PTSP24H48), few CD4+ cells were able to migrate towards the chemoattractant as compared to the control. The 5 µm insert (PTMP24H48) had a distinct difference of CD4+ migration in presence of the chemoattractant. The 8 µm insert (PTEP24H48) had increase flow-through of CD4+ cells in absence or presence of chemoattractant. This qualitative observation indicates the 5 µm insert would be the optimal pore size for Human CD4+ migration assays.

Figure 7aA flow cytometry method to quantify CD4+ migrated cells towards chemoattractant, CXCL12. First, propidium iodide was added to the basolateral sample to differentiate live versus dead cells.

Figure 7bThen, calibration beads were utilized to normalize the number of events collected and samples were analyzed with the Guava®easyCyte™ 8HT Flow Cytometer. Three populations were detected - the calibration beads in the Red2 fluorescence channel, a live cell population, and a dead cell population in the Red fluorescence channel.

Figure 7cLive versus dead cell counts were determined by gating.

Figure 7dThe live cell count represents the number of cells migrated towards CXCL12.
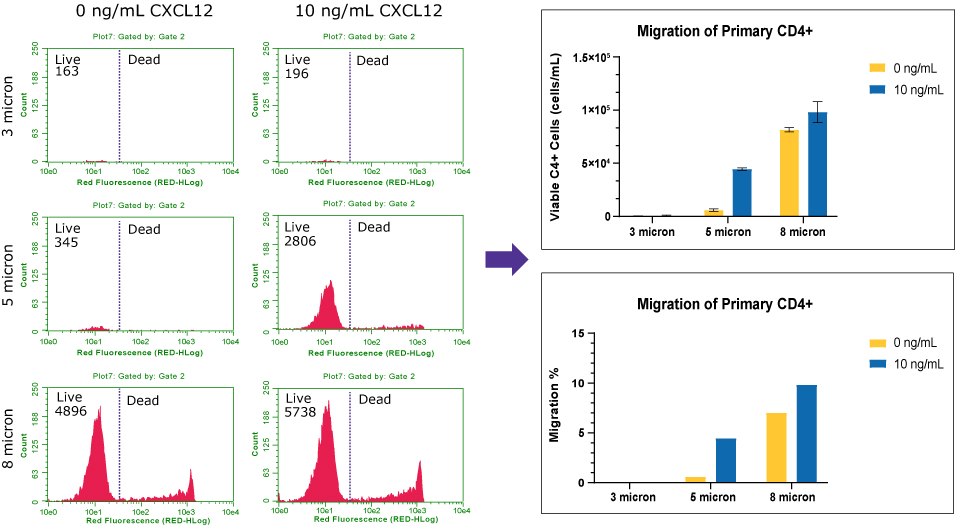
Figure 8Chemotaxis of Human primary CD4+ to CXCL12/SDF1-α. The histograms (left) represent the live and dead cell count of Human primary CD4+ across three pore sizes. Viable counts were converted to percent of migration (right). With the 3 µm insert, few CD4+ cells were able to migrate (0.3%) towards CXCL12, similar to the control. The 5 µm insert had a distinct difference of CD4+ migration in presence of the chemoattractant, with 4% migration. The 8 µm insert had increase flow-through of CD4+ cells in absence (7.5% migration) or presence (8% migration) of chemoattractant. The flow cytometry analysis indicates the 5 µm insert would be the optimal pore size for Human CD4+ migration assays. For increase migration rates, fresh CD4+ can be utilized.
References
如要继续阅读,请登录或创建帐户。
暂无帐户?