Faster Protein LC (FP2LC)
Introducing BIOshell™ Fused-Core® U/HPLC Columns
Abstract
A new and broad product line for the analysis of peptides and proteins by reversed-phase high performance liquid chromatography (RP-HPLC) is introduced under the name BIOshell™ Fused-Core® U/HPLC columns. As the Ascentis® Express column line for the analysis of small molecular mass compounds, BIOshell™ columns outperform fully porous silica-based columns of the same particle size in terms of one or more important chromatographic attributes; such as efficiency, resolution, analysis time (speed) and back pressure. By providing faster peptide and protein liquid chromatography (FP2LC), the benefits of porous-shell columns are now also available to scientists who are tasked to advance our knowledge about the living world.
Background and Characteristics
The development of Fused-Core® U/HPLC columns is based on the pellicular silica technology developed by J. J. Kirkland at E. I. du Pont de Nemours and Company in the late 1960s during the formative years of HPLC, and applied in this century to create very efficient particles in the range of 2.7 to 5 micron1,2. The latest innovations derived from this technology are now available as BIOshell™ Fused-Core® columns for faster protein and peptide liquid chromatography (FP2LC) separations. BIOshell™ columns for peptide analysis are either packed with 2.7 or 5 micron particles containing 160 Å pores and bonded with a C18 alkyl or alkyl cyano functionality, while protein separations are best performed with 3.4 micron particles containing 400 Å pores bonded with C4 alkyl functional groups. The complete list of available BIOshell™ columns is provided at the end of this article.
In 2007 Supelco introduced the groundbreaking Ascentis® Express Fused-Core® column line for the analysis of compounds with low molecular mass. In the succeeding years it has become clear that (a) columns packed with 2.7 micron, 90 Å pore size, porous-shell particles provide a dramatic and unexpected improvement in column efficiency, rivaling the efficiency of columns packed with fully porous 1.7 micron particles, and (b) a paradigm shift had to take place in the minds of theoreticians to adjust the theory of chromatographic band broadening to account for column efficiencies that were, until then, considered outside the realm of possibility3,4.
Like the particles in Ascentis® Express columns, the particles in BIOshell™ columns are composed of a spherical solid glass core surrounded by a thin layer of nano- size silica particles. Table 1 summarizes the characteristics and maximum operating conditions of the new BIOshell™ porous-shell columns.
As shown in Table 1, to accommodate the larger size of biopolymers, the particles in BIOshell™ columns either feature 160 Å pores for unhindered access by peptides up to a mass of about 20 kDa, or 400 Å pores for proteins with a molecular mass up to about 500 kDa. Note that the thickness of the porous shell varies as does the percentage of the surface area when compared to a fully porous particle of the same size. Thus, the 0.2 micron shell for the 3.4 micron particles results in a surface area that is 31% of a fully porous particle of that size. Similarly, the 0.5 micron shell for the 2.7 micron particle provides 75% of the maximum surface area, while the 0.6 micron shell for the nominally 5 micron but actually 4.7 micron particles contains 59% of the surface area of a fully porous particle. Although the loss of surface area may seem a cause of concern, Unger et al., first demonstrated that even nonporous matrices provide sufficient retention for larger biomolecules, while Gritti and Guiochon showed that the capacity of core-shell particles is not substantially reduced even for large biopolymers, a conclusion that was recently confirmed in a paper from Guillaume et al., who found that the loading capacity of a wide pore core-shell column was 2–3 fold less than that of a fully porous column5-7.
Table 1 also shows the bonded phase characteristics, recommended pH range, and the highest values for back pressure and temperature at which each particle type was tested. While a maximum pressure of 600 bar or 9,000 psi may seem modest in current day UHPLC systems, a maximum operating temperature of 80–100 °C provides a degree of freedom that can be very beneficial, particularly when working with more hydrophobic proteins, including monoclonal antibodies, as will be illustrated in the following proof statements.
Table 1. Characteristics and Operating Conditions of BIOshell™ Fused-Core® Columns
| Nominal Values | ||||||
|---|---|---|---|---|---|---|
| Physical Parameter | Dp (µm) | Core (µm) | Shell (µm) | Pore Size (Å) |
SBET (m2/g) |
Capacity vs. Porous |
| 2.7 µm A160 Peptide C18 | 2.7 | 1.7 | 0.5 | 160 | 80 | 75% |
| 2.7 µm A160 Peptide CN | 2.7 | 1.7 | 0.5 | 160 | 80 | 75% |
| 5 µm A160 Peptide C18 | 4.7 | 3.5 | 0.6 | 160 | 60 | 59% |
| 5 µm A160 Peptide CN | 4.7 | 3.5 | 0.6 | 160 | 60 | 59% |
| 3.4 µm A400 Protein C4 | 3.4 | 3.0 | 0.2 | 400 | 15 | 31% |
| Phase Characteristics and Operating Conditions | ||||||
| Physical Parameter | Bonded Phase Ligand | End Capped |
Tmax °C |
pH Range |
Pmax (bar) |
Frit (µm) |
| 2.7 µm A160 Peptide C18 | di-isobutyl-octadecylsilane | No | 100 | 1–8 | 600 | 2 |
| 2.7 µm A160 Peptide CN | di-isopropyl-cyanopropylsilane | Yes | 90 | 1–8 | 600 | 2 |
| 5 µm A160 Peptide C18 | di-isobutyl-octadecylsilane | No | 100 | 1–8 | 600 | 2 |
| 5 µm A160 Peptide CN | di-isopropyl-cyanopropylsilane | Yes | 90 | 1–8 | 600 | 2 |
| 3.4 µm A400 Protein C4 | dimethylbutylsilane | Yes | 90 | 2–9 | 600 | 2 |
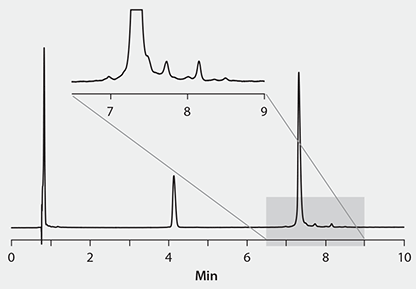
The chromatogram in Figure 1 shows the analysis of IgG2-B subtype monoclonal antibody following solubilization and reduction of the sulfide bonds with 100 mM dithiothreitol (DTT) in 8 M guanidine HCl at 50 °C for 35 minutes. The main components in Figure 1 are the light (LC) and heavy (HC) chains of IgG2-B. The inset clearly shows several expected variants near the heavy chain peak, although the identity of the minor peaks was not confirmed. The analysis was performed at 80 °C based on the results from Dillon and co-workers at Amgen, which were more recently confirmed by other groups8-11.

Figure 1.High Temperature Analysis of IgG2-B Antibody Fragments Using a 10 cm x 2.1 mm I.D. BIOshell™ A400 Protein C4 Column
CONDITIONS: column: BIOshell™ A400 Protein C4, 10 cm x 2.1 mm I.D., 3.4 µm (66825-U); mobile phase: A: water:0.1% TFA, B: acetonitrile:water:0.1% TFA, 80:20; gradient: 33-40% B in 10 min; flow rate: 0.25 mL/min; temp: 80 °C; detection: 280 nm; injection: 1 µL; sample: 0.5 mg/mL IgG2-B treated with 100 mM DDT in 8 M guanidine HCl at 50 °C for 35 min; instrument: Shimadzu™ Nexera®
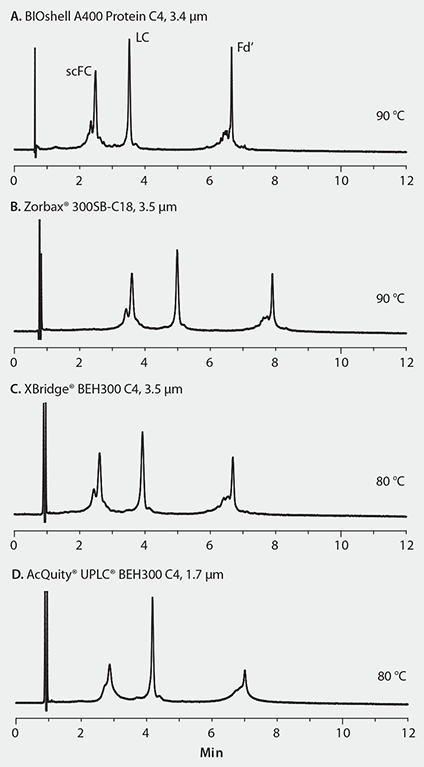
Another example of the need to operate reversed-phase columns at high temperature is provided in Figure 2, in which a so-called middle-down, as opposed to a top-down or bottom-up, approach was used to analyze the structure of a monoclonal antibody. In a middle-down approach IgG is digested into a few large fragments prior to further characterization. The novel proteolytic enzyme IdeS, commercially available as FabRICATOR®, cleaves an antibody into F(ab’)2 and scFc fragments, which have approximate molecular masses of 100 kDa and 25 kDa respectively. Using disulfide reduction, the F(ab’)2 fragment can be further resolved into its light-chain (LC) and F(ab) components. Each of the components in the resulting mixture has a molecular mass of about 25 kDa.
Visual inspection of the results shown in Figure 2 reveals that when run at 90 °C, the BIOshell™ A400 Protein C4 column (A) provides narrower peak widths and better peak shape than a competitive column packed with fully porous 3.5 micron particles (B). The same conclusion can be drawn from the results for two other competitive columns (C and D) which were operated at 80 °C, the highest temperature recommended by their manufacturer. The ability to operate BIOshell™ A400 Protein C4 columns at 90 °C provides a beneficial degree of flexibility for biochemists involved in the development and analysis of antibody-based biotherapeutic drugs.

Figure 2.Analysis of Antibody Fragments on Wide Pore Reverse-Phase Columns Operated at Maximum Recommended Temperature
CONDITIONS: column: as indicated, 10 cm x 2.1 mm; mobile phase A: 80:20, (water, 0.1% TFA) : (acetonitrile, 0.1% TFA); mobile phase B: 50:50, (water, 0.1% TFA) : (acetonitrile, 0.1% TFA); gradient: 30 to 70% B in 12 min; flow: 0.3 mL/min; column temp.: as indicated; detection: UV, 215 nm; injection: 1 µL, after sample diluted in mobile phase A
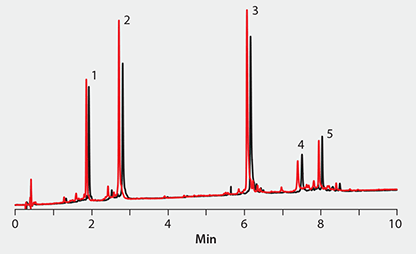
To determine the stability of columns packed with large pore Fused-Core® particles with continued operation at high temperature and flow rate, five globular protein standards were repeatedly injected on a 10 cm x 2.1 mm I.D. BIOshell™ A400 Protein C4 column. The results are shown in Figure 3 for the first and last injection of an experiment in which the column was exposed to repeated 10 minute gradients from 25 to 40% acetonitrile/0.1% trifluoroacetic acid (TFA) in water at a flow rate of 0.5 mL/min and a temperature of 90 °C. A noticeable but small loss of retention was observed for all proteins after the column had been in contact with almost 15,000 gradient column volumes (1 CV ~ 0.2 mL) at 90 °C under acidic (pH ~ 2.0) conditions. Note that the peak shape and peak widths of the test proteins did not change during the experiment, indicating excellent physical stability of BIOshell™ Fused-Core® columns.

Figure 3. BIOshell™ A400 Protein C4: Column Stability
PEAK IDs: 1. Cytochrome c (12.4 kDa); 2. Lysozyme (14.3 kDa); 3. Apomyoglobin (17 kDa); 4. Catalase (250 kDa total; tetramer of ~60 kDa each); 5. Enolase (93 kDa total; dimer of 46.7 kDa each)
CONDITIONS: column: BIOshell™ A400, 10 cm x 2.1 mm 3.4 µm (66825-U); mobile phase A: water:0.1% TFA; mobile phase B: acetonitrile:0.1% TFA; gradient: 25-40% B in 10 min; flow rate: 0.5 mL/min; column temp: 90 °C; detection: 215 nm; injection: 1.0 µL; instrument: Shimadzu Nexera
In a final example, Figure 4 shows chromatograms of a mixture of 5 different tryptic digests (cytochrome c, β-lactoglobulin, glutamate dehydrogenase, carbonic anhydrase, myoglobin) run on both a 2.7 micron BIOshell™ A160 Peptide C18 column and a fully porous 5 micron C18 column of the same dimensions. The analyses were run at the same flow rate of 0.3 mL/min and with the same starting and final gradient mobile phase composition. However, to account for the smaller pore volume of the Fused-Core® particles in the BIOshell™ column, the gradient times were adjusted so that each column was exposed to the same number of gradient column volumes, 46 in this case. About 20 peaks from across the chromatograms (Figure 4) were extracted from the MS data to serve as a representative sample in the calculation of the peak capacity (Pc) for each column, using the accepted definition Pc = gradient time/ average peak width. Peak widths were calculated at baseline for each of the 20 selected peptides. Table 2 lists the experimental values for the gradient time (tg) and the average peptide peak width (w) as well as the calculated peak capacity for this particular separation on each column.
The 2.7 µm BIOshell™ column showed a 40% increase in peak capacity over the 5 micron Zorbax 300SB-C18 porous column which is in agreement with the results obtained by Gilar et al. who confirmed results from earlier workers that peak capacity is proportional to the square root of the plate number12.

Figure 4.Peak Capacity of a Commercial Fused-Core® and Fully Porous Reversed Column for a Peptide Digest Mixture
CONDITIONS: columns: as indicated, 15 cm x 2.1 mm; mobile phase A: 0.1 % formic acid; mobile phase B: 25:75, (0.4 % formic acid):acetonitrile; gradient: as indicated (in terms of column volumes); flow rate: as indicated; column temp.: 35 °C; det.: ESI(+)-TOF; injection: 2 µL; sample: 10 pmol / µL
Conclusions
The advances brought about by using porous shell particles with narrow particle size distribution for the analysis of small molecular weight compounds, commercially available as Ascentis® Express columns, have been expanded to the reversed-phase U/HPLC analysis of peptides and proteins. As expected and demonstrated, larger pore size BIOshell™ Fused-Core® columns provide benefits in terms of efficiency per unit pressure drop, which can either be taken advantage of by increasing peak capacity or traded in to reduce analysis time, benefits that are captured in the acronym FP2LC, or Faster Peptide and Protein Liquid Chromatography.
Trademarks
Fused-Core® is a registered trademark of Advanced Materials Technology, Inc.
Ascentis® is a registered trademark of Sigma-Aldrich Co. LLC
BIOshell™ is a trademark of Sigma-Aldrich Co. LLC
FabRICATOR® is a registered trademark of Genovis AB
Shimadzu® and Nexetra® are registered trademarks of Shimadzu Corporation
Acknowledgment:
The authors thank Stephanie A. Schuster and Robert E. Moran from Applied Materials Technologies, Inc. for contributing Figures 1 and 3.
Materials
如要继续阅读,请登录或创建帐户。
暂无帐户?