跳转至内容
Merck
CN
HomeSmall Molecules Analysis & QCSafinamide Impurity Profiling by HPLC Assay Methods

Safinamide Impurity Profiling by HPLC Assay Methods

Neil J. Williams1, Jenna Milliken1

Merck

INTRODUCTION

A simple and accurate method was developed for purity analysis of safinamide using high-performance liquid chromatography with a diode array detector (HPLC-DAD). The method was developed for a family of safinamide compounds consisting of the active pharmaceutical ingredient safinamide and multiple corresponding impurities. This is to our knowledge the first reported method for safinamide and related impurities. Safinamide free acid, safinamide mesylate, safinamide defluor-derivative, and safinamide imidazolidinone can be resolved in a 20-minute method using an Ascentis® Express C8 column (150 x 4.6 mm, 5 μm). A gradient that utilized 0.1% trifluoroacetic acid in water and acetonitrile was employed. Under the applied conditions the system suitability criteria are met. The method demonstrates good resolution and selectivity, reproducibility, and sensitivity.

Chemical structures for Safinamide Free Acid, Safinamide Mesylate, Safinamide Deflour-Derivative, and Safinamide Imidazolidinone

Safinamide Free Acid
PHR2380

Safinamide Mesylate
PHR2379

Safinamide Deflour-Derivative
PHR2381

Safinamide Imidazolidinone
PHR2382

EXPERIMENTAL CONDITIONS

Results

A chromatogram displaying a blue line graph with the x-axis labeled "Time (min)" ranging from 0 to 25 minutes, and the y-axis labeled "Intensity (mAU)" ranging approximately from -40 to 80 mAU. The graph shows fluctuations in intensity over time, with a general trend of decreasing values followed by a gradual increase towards the end.

Figure 1.Blank chromatogram.

A chromatogram illustrating the analysis of a safinamide mesylate system suitability solution, featuring a blue line graph. The x-axis is labeled "Time (min)" ranging from 2 to 16 minutes, while the y-axis is labeled "Intensity (mAU)" ranging from -100 to 1300 mAU. The graph displays a sharp peak at approximately 12 minutes, reaching an intensity of around 1200 mAU, with a label "3" positioned above the peak. The baseline shows minimal fluctuations before and after the peak.

Figure 2.Chromatogram for safinamide mesylate system suitability solution.

A chromatogram depicting the analysis of a resolution solution, shown as a blue line graph. The x-axis is labeled "Time (min)" ranging from 2 to 16 minutes, and the y-axis is labeled "Intensity (mAU)" ranging from -40 to 560 mAU. The graph features four distinct peaks, with the highest peaks occurring around 10 to 12 minutes. Labels "1," "2," "3," and "4" are positioned above the respective peaks, indicating their sequence. The baseline remains relatively stable with minimal fluctuations throughout the duration.

Figure 3.Chromatogram for resolution solution.
Chromatographic Data - Specificity (Resolution Solution)

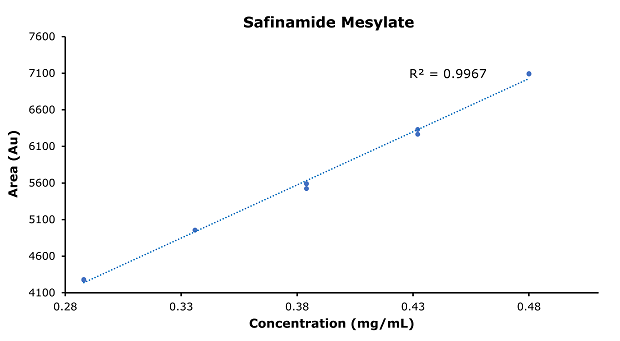
Linearity - Calibration

A calibration curve for safinamide mesylate displayed as a scatter plot with a blue dotted line. The x-axis is labeled "Concentration (mg/mL)" ranging from 0.28 to 0.48, and the y-axis is labeled "Area (Au)" ranging from 4100 to 7600. Data points are represented by blue dots, showing a positive correlation between concentration and area. An R² value of 0.9967 is indicated on the graph, suggesting a strong linear relationship. The title "Safinamide Mesylate" is prominently displayed at the top of the graph.

Figure 4.Calibration curve of safinamide mesylate.
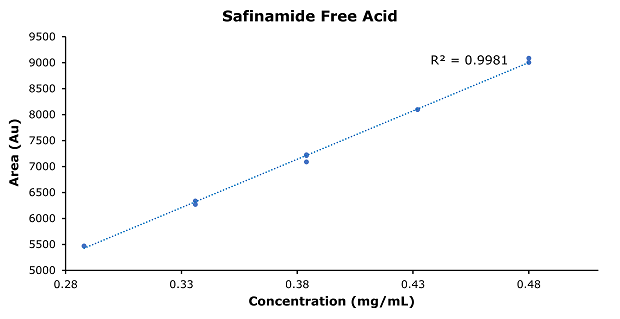
A calibration curve for safinamide free acid presented as a scatter plot with a blue dotted line. The x-axis is labeled "Concentration (mg/mL)" ranging from 0.28 to 0.48, and the y-axis is labeled "Area (Au)" ranging from 5000 to 9500. The data points are represented by blue dots, indicating a positive correlation between concentration and area. An R² value of 0.9981 is displayed on the graph, indicating a strong linear relationship. The title "Safinamide Free Acid" is prominently positioned at the top of the graph.

Figure 5.Calibration curve of safinamide free acid.

A calibration curve for safinamide defluro-derivative displayed as a scatter plot with a blue dotted line. The x-axis is labeled "Concentration (mg/mL)" ranging from 0.28 to 0.48, and the y-axis is labeled "Area (Au)" ranging from 5800 to 10300. Blue dots represent the data points, illustrating a positive correlation between concentration and area. An R² value of 0.9977 is noted on the graph, indicating a strong linear relationship. The title "Safinamide Defluro-Derivative" is prominently featured at the top of the graph.

Figure 6.Calibration curve of safinamide defluro-derivative.
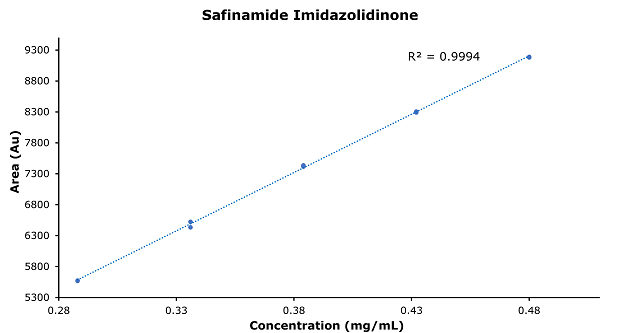
A calibration curve for safinamide imidazolidinone presented as a scatter plot with a blue dotted line. The x-axis is labeled "Concentration (mg/mL)" ranging from 0.28 to 0.48, and the y-axis is labeled "Area (Au)" ranging from 5300 to 9300. The graph features blue dots representing data points, showing a positive correlation between concentration and area. An R² value of 0.9994 is indicated on the graph, reflecting a strong linear relationship. The title "Safinamide Imidazolidinone" is prominently displayed at the top of the graph.

Figure 7.Calibration curve of safinamide imidazolidinone.

CONCLUSION

A new method was developed for analyzing the purity of safinamide and its related compounds using high-performance liquid chromatography with a diode array detector. The method uses an Ascentis® Express C8 HPLC column and a gradient of 0.1% trifluoroacetic acid in water and acetonitrile and takes 20 minutes to resolve the compounds. The method is reproducible and sensitive and shows good resolution and selectivity.

See also Small Molecules Analysis & Quality Control (QC) for more information on other applications or use our chromatogram search.

登录以继续。

如要继续阅读,请登录或创建帐户。

暂无帐户?