Skip to Content
Merck
CN
HomeSmall Molecule HPLCAnalysis of Arbutin and Hydroquinone in whitening serum

Analysis of Arbutin and Hydroquinone in whitening serum using a Chromolith® HighResolution RP-18e 2 mm I.D. HPLC column

Anita Piper, R&D Chemist, Lara Celia Bergner


Introduction

Bleaching or skin whitening serums are widely used to reduce melanin content in the skin, and for such products, analytical quality control is required. Hydrochinone is a decomposition product of arbutin which can cause severe contact dermatitis in humans.

This report focuses on the testing of arbutin and hydroquinone in formulated serum products. A Chromolith® HighResolution RP-18 endcapped column 100x2mm was used on an HPLC-UV instrument, and can improve existing methods (e.g. Int. J. Appl. Sci. Eng., 2011.9.4)1.
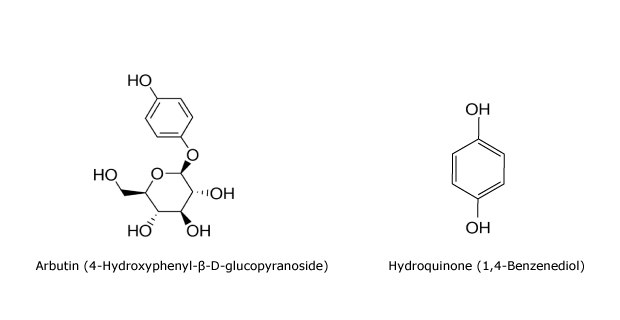
Two images- on the left bond line chemical structure of arbutin and on the right bond line chemical structure of hydroquinone

EXPERIMENTAL CONDITIONS

Results

Calibration and Repeatability

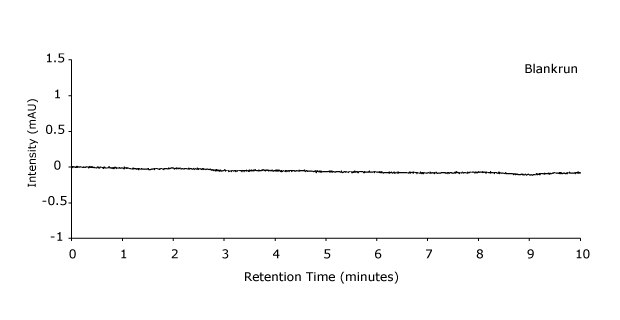
A Chromatogram obtained for the blank run in the HPLC-UV analysis of arbutin and hydroquinone with intensity on the y-axis and retention time measured in minutes on the x-axis showing a straight line running parallel to the x-axis

Figure 1.Chromatogram blank.

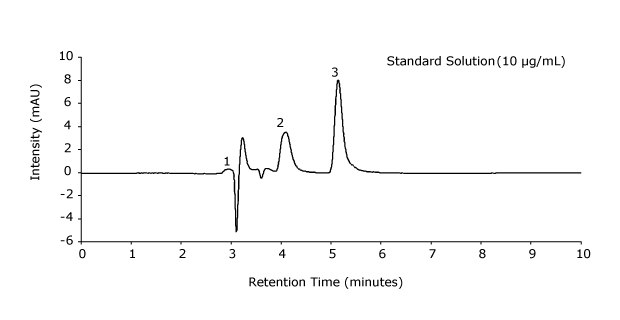
A Chromatogram obtained for a standard solution of arbutin and hydroquinone with 10 µg/mL each in an HPLC-UV analysis with intensity on the y-axis and retention time measured in minutes on the x-axis showing three distinct peaks labeled 1,2, and 3.

Figure 2.Chromatogram standard solution arbutin and hydroquinone each at 10 µg/mL.

Chromatographic Data - Standard Solution (10 µg/mL )

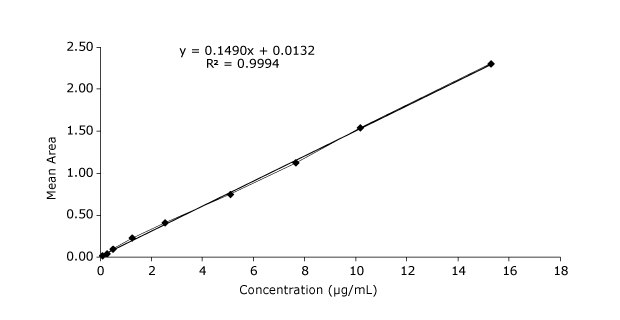
Specificity Test: The standard solution of arbutin and hydroquinone (each at 10 µg/mL) was injected and the retention time and content of desired analyte determined (Table 1). Repeatability was determined by 5 injections of a serum sample solution (Table 2). Calibration and sensitivity results for arbutin and hydroquinone (calibration range 0.10-15.5 µg/mL for arbutin and 0.10-15.3 µg/mL for hydroquinone with 9 calibrators) are shown in Table 3.
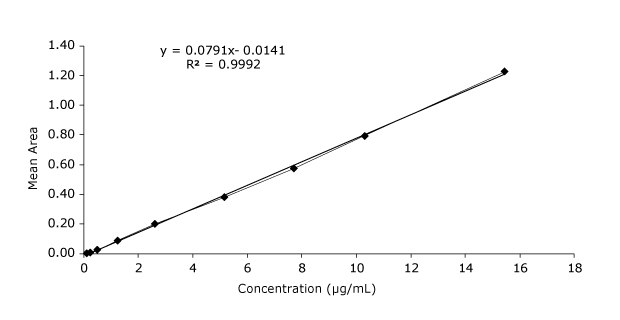
Table 1. Specificity test results (standard solution of arbutin and hydroquinone at 10 µg/mL each)
Table 2.Repeatability of sample solution (serum with arbutin)
Table 3.Calibration and sensitivity results for arbutin and hydroquinone (calibration range 0.10-15.5 µg/mL for arbutin and 0.10-15.3 µg/mL for hydroquinone with 9 calibrators).
Calibration curve with mean area on y-axis and concentration in µg/mL on the x-axis, obtained for arbutin measured at different concentrations in the range of 0.10-15.5 µg/mL, showing a straight line starting from 0, following the equation for straight line y=mx+c with m value of 0.0791 and c value of 0.0141, along with R2 value of 0.9992

Figure 3.Calibration curve arbutin.

Calibration curve with mean area on y-axis and concentration in µg/mL on the x-axis, obtained for hydroquinone measured at different concentrations in the range of 0.10-15.3 µg/mL, showing a straight line starting from 0, following the equation for straight line y=mx+c with m value of 0.1490 and c value of 0.0132, along with R2 value of 0.9994

Figure 4.Calibration curve hydroquinone.
The LOD & LOQ in the injected standard solution represent limits for the serum samples of 1.13 mg/g (LOD) and 3.42 mg/g (LOQ) for arbutin 0.21 mg/g (LOD) and 0.58 mg/g (LOQ) for hydroquinone.

Serum Sample Results

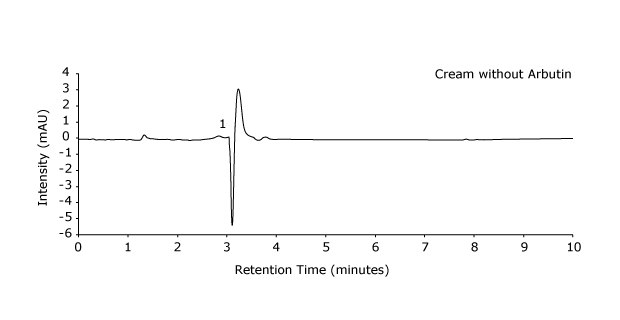
A Chromatogram obtained for a serum sample not containing arbutin in an HPLC-UV analysis with intensity on the y-axis and retention time measured in minutes on the x-axis showing only time of the unretained peak (t0) nad no peak for arbutin

Figure 5.Chromatogram serum without arbutin.
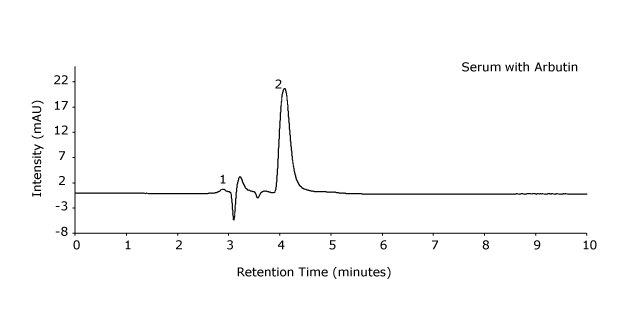
A Chromatogram obtained for a serum sample containing arbutin in an HPLC-UV analysis with intensity on the y-axis and retention time measured in minutes on the x-axis showing two peaks labeled, 1 and 2. Peak 1 corresponds to time of the unretained peak (t0) and peak 2 for arbutin

Figure 6.Chromatogram serum containing arbutin

Chromatographic Data - Serum with Arbutin

Calculation

ωSample  =         cst/cPr

ωSample  =   (63.00 μg/mL) / (2.4 mg/mL)

ωSample  =    26.25 µg/mg  or 2.63% Arbutin in Serum

where,

ωSample  = Concentration of Arbutin in the sample 

cst    = Concentration calculated from calibration curve (µg/mL)

cPr     = Concentration of serum sample in final dilution (mg/mL)

Conclusion

It was shown, that a Chromolith® HighResolution RP-18e 100x2mm column coupled to UV detection can be utilized for the determination of arbutin and hydrochinone in serum. For arbutin, the resulting limit of detection (LOD) was 2.7 µg/mL, and the limit of quantitation (LOQ) was 8.2 µg/mL in the final dilution sample, representing limits for the serum samples of 1.13 mg/g (LOD) and 3.42 mg/g (LOQ); for hydroquinone, the results were 0.5 µg/mL (LOD) and 1.4 µg/mL (LOQ) in the final dilution sample, representing limits for the serum samples of 0.21 mg/g (LOD) and 0.58 mg/g (LOQ). Due to the excellent permeability and low backpressure of this column type, an analytical HPLC-System with a micro cell could be used.

See more chromatograms for cosmetic applications


Related Products
Loading

References

1.
Wang A, Cheng S, Kwan C. 2011. Simultaneous determination of five whitening agents by ion-pair reversed-phase high performance liquid chromatography. [Internet]. Int. J. Appl. Sci. Eng. Available from: https://gigvvy.com/journals/ijase/articles/ijase-201112-9-4-287
Sign In To Continue

To continue reading please sign in or create an account.

Don't Have An Account?