Rapid, Sensitive, and Quantitative LC/MS/MS Determination of Digitoxin and Digoxin in Plasma
Using a Simple Procedure for Simultaneous Cleanup of Phospholipids and Proteins
Section Overview
Introduction
Digitoxin and digoxin are cardiac glycosides derived from the digitalis purpurea (Foxglove) plant. They have been in use for centuries for treatment of various heart conditions. Because of their narrow therapeutic range and high toxicity, their levels in patients taking digitoxin or digoxin are monitored1-2. Immunoassay- based methods for digitoxin or digoxin exist, but are both time consuming and labor intensive. Moreover, the reported immunoassay methods are not selective toward digitoxin or digoxin due to the similarities in their chemical structures, which differ from each other in only one hydroxyl group (Figure 1). The present work was aimed at developing a rapid and selective LC/MS/MS method for the determination of digoxin and digitoxin in biological fluids. In addition, a simple sample cleanup technique for simultaneous removal of proteins and phospholipids using a zirconia-based sorbent, HybridSPE®-PLus, was explored.
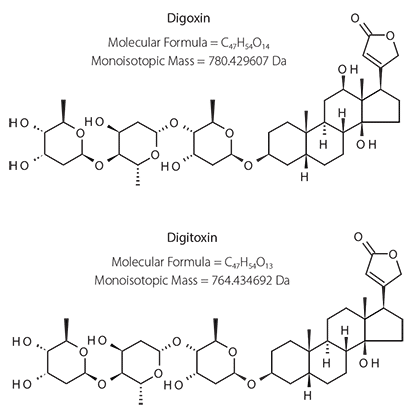
Figure 1.Structures of Digitoxin and Digoxin
Experimental
A 100 µL sample of spiked rat plasma was added to the well of a HybridSPE-PLus 96-well plate followed by 300 µL of 1% formic acid in acetonitrile to precipitate the proteins. The plate was sealed with plastic film and agitated by vibration at 1,000 rpm for 2 minutes on a digital shaker. The plate was transferred to a vacuum manifold and the seal was removed. Vacuum (10 in. Hg) was applied for 4 minutes. The flow-through eluate was analyzed by LC/MS/MS. A Titan™ C18 column packed with 1.9 µm monodisperse, totally porous silica particles was chosen for the UHPLC separation of digitoxin and digoxin. Different mobile phase systems were studied.
Results and Discussion
Effect of Mobile Phase Composition on MS Spectra
The effect of mobile phase composition was dramatic. Figure 2A shows digitoxin and digoxin are ionized primarily as sodium adducts in the 0.1% formic acid in acetonitrile: water (50:50) mobile phase. Because sodium ions have much higher affinity to digoxin and digitoxin in the gas phase than protons (H+), the sodium adducts are the primary ion in the 0.1% formic acid in acetonitrile-water mobile phase. Further experiments showed the sodium adduct ions are scarcely fragmented in MS/MS regardless of collision energy and gas pressure, thus not amenable to being monitored in MS/MS mode. This issue of forming sodium adducts can be overcome by replacing the mobile phase with water: methanol containing ammonium formate.
Digitoxin and digoxin generate primarily ammonium adducts when ammonium formate replaces the formic acid in the mobile phase (Figure 2B). The ammonium adducts of digitoxin and digoxin are shown to be readily fragmented under mild collision conditions (Figure 3). The MRM transitions 782.5/635.5 and 798.5/651.5 were chosen for LC/MS/MS quantification of digitoxin and digoxin, respectively.
![Rapid, Sensitive, and Quantitative LC/MS/MS Determination of Digitoxin and Digoxin in Plasma A comparison of mass spectrometry graphs for Digitoxin (top) and Digoxin (bottom). Both graphs display intensity on the y-axis (in ×100,000) and mass-to-charge ratio (m/z) on the x-axis, ranging from 600 to 950. Key peaks are labeled in red, indicating the [M+Na]+ ion, with specific m/z values noted for each compound. The Digitoxin graph shows prominent peaks around 787.5 and 788.5, while the Digoxin graph highlights peaks around 803.5.](/deepweb/assets/sigmaaldrich/marketing/global/images/technical-documents/protocols/analytical-chemistry/solid-phase-extraction/t215003-digitoxin-digoxin-fig-2a.gif)
Figure 2A.MS Spectra of Digoxin and Digitoxin in Formic Acid Mobile Phase
Conditions
mobile phase: 0.1% formic acid in water: acetonitrile (50:50)
![Rapid, Sensitive, and Quantitative LC/MS/MS Determination of Digitoxin and Digoxin in Plasma A comparison of mass spectrometry graphs for Digitoxin (top) and Digoxin (bottom). The graphs display intensity on the y-axis (in ×100,000) and mass-to-charge ratio (m/z) on the x-axis, ranging from 500 to 950. Key peaks are labeled in red, indicating the [M+NH]+ and [M+Na]+ ions, with specific m/z values noted for each compound. The Digitoxin graph shows significant peaks at 782.7 and 787.6, while the Digoxin graph features prominent peaks at 798.6 and 825.7.](/deepweb/assets/sigmaaldrich/marketing/global/images/technical-documents/protocols/analytical-chemistry/solid-phase-extraction/t215003-digitoxin-digoxin-fig-2b.gif)
Figure 2B. MS Spectra of Digoxin and Digitoxin in Ammonium Formate Mobile Phase
Conditions
mobile phase: 10 mM ammonium formate in water:methanol (50:50)
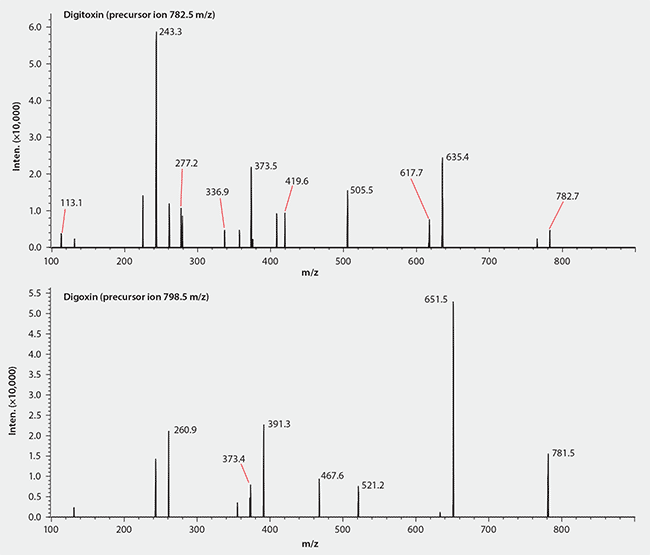
Figure 3.MS/MS Spectra of Digitoxin and Digoxin (Ammonium Adducts)
Conditions
mobile phase: 10 mM ammonium formate in water:methanol (50:50)
Linearity and LOD of the LC Method
Figure 4 shows the two analytes are well resolved by the Titan C18 column within four minutes. The limit of detection of the LC/MS/MS method was approximately 0.01 ng/mL of the analyte standard. The calibration curve of the method is linear over a range of three orders of magnitude, with a linearity (r2) >0.999 (Figure 5).
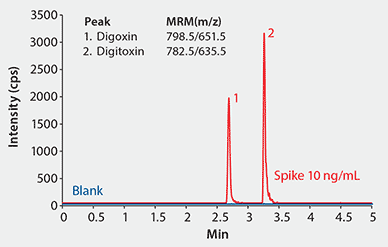
Figure 4.MS Spectra of Digoxin and Digitoxin in Ammonium Formate
Conditions
column: Titan C18, 10 cm x 2.1 mm I.D., 1.9 µm particles (Product No. 577124-U); mobile phase: 10 mM ammonium formate in water:methanol (20:80); flow rate: 0.2 mL/min; pressure: 4550 psi; column temp.: 35 °C; detector: MS, ESI(+), MRM; injection: 2 µL; sample: rat plasma, blank and spiked at 10 ng/mL, extracted with HybridSPE-PLus; instrument: Shimadzu LCMS-8030

Figure 5.LC/MS/MS Calibration Curves for Digitoxin and Digoxin
Comparison of Sample Prep Techniques
Protein precipitation is widely used for sample preparation of biological matrices prior to LC/MS analysis. The approach is effective in eliminating proteins, but not in removing phospholipids3. Indeed, multiple species of phospholipids were present in high amounts in the rat plasma after protein precipitation as reflected by their intense MS signals (Figure 6A). This study exploited HybridSPE-PLus which specifically and effectively eliminated both precipitated proteins and phospholipids from the plasma samples (Figure 6B)
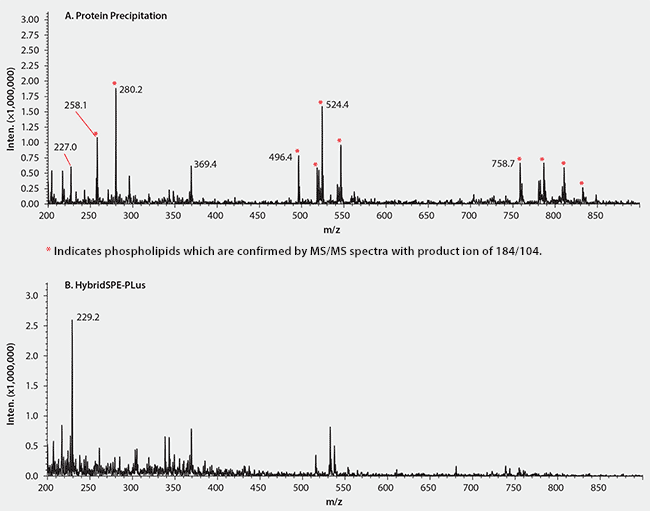
Figure 6.Improved Recovery of Digitoxin and Digoxin using HybridSPE-PLus Compared to Conventional Protein Precipitation
The mechanism behind the effectiveness of HybridSPE-PLus technology is based on the unique Lewis acid/Lewis base interaction between the zirconia and the phosphate group of phospholipids4.
Figure 7 compares the effectiveness of the two sample preparation techniques, standard protein precipitation and HybridSPE-PLus, on the LC/MS/MS signals. The ion signals of both analytes of the samples prepared by standard protein precipitation were only one-third to one-fourth of those of the samples prepared by HybridSPE-PLus, resulting in low recoveries (Table 1). Furthermore, the ion signals of both analytes following standard protein precipitation decreased with increasing number of injections, likely from build-up of phospholipids on the column, leading to irreproducible results and shortened column lifetime. In contrast, the samples prepared by HybridSPE-PLus exhibited high recoveries (>90%) with good reproducibility (<6% RSD). Matrix effects were essentially eliminated by using the HybridSPE-PLus method.
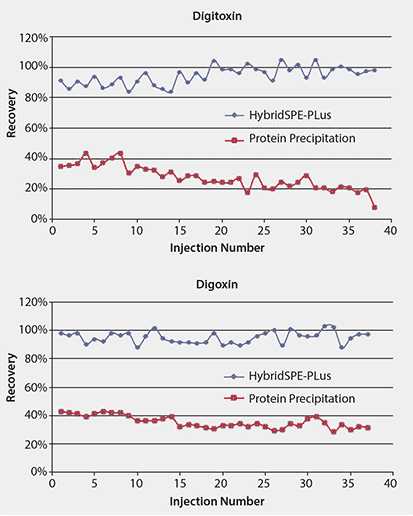
Figure 7.Improved Recovery of Digitoxin and Digoxin using HybridSPE-PLus Compared to Conventional Protein Precipitation. This figure shows the change in LC/MS/MS signal intensity with serial injections of spiked rat serum prepared by using protein precipitation or HybridSPE-PLus.
Conditions
Sample: 10 ng/mL digitoxin and digoxin spiked in rat plasma.
Conditions as in Figure 4.
Summary
A rapid and sensitive LC/MS/MS method has been developed for the determination of digitoxin and digoxin in plasma. A Titan™ C18 UHPLC column with monodisperse particles was employed to resolve the two analytes within four minutes. Severe matrix effects, including ion suppression and irreproducibility, that were observed using standard protein precipitation procedures were overcome by utilizing HybridSPE-PLus, an innovative technique for simple and quick sample cleanup of phospholipids and proteins in biological matrices.
如要继续阅读,请登录或创建帐户。
暂无帐户?