Natural Cannabinoid and Cannflavin Profiling by HPLC-PDA
Introduction
Cannabinoids are a diverse group of diterpenoid compounds primarily observed in Cannabis and Rhododendron species. To date, over 120 phytocannabinoids have been identified and quantified in Cannabis extracts using analytical techniques such as High Performance Liquid Chromatography (HPLC). With the federal legalization of hemp, a type of Cannabis, and state-supported legalization measures for high-THC Cannabis, HPLC testing of dried plant material for psychotropic potency and therapeutic dosing has become part of nearly every piece of legislation. While numerous chromatographic methods have been developed for Cannabis Testing and the detection and quantification of THCA, CBDA, CBGA, CBNA, and their decarboxylated forms, many do not account for the possibility of coelutions with other secondary metabolites in plant samples such as cannabinoids, flavonoids, and terpenes. To complicate analyses further, the metabolomes of different Cannabis varieties can vary greatly, resulting in chromatographic coelutions that are present in some extracts but not in others.
The method presented in this application note attempts to resolve most of the significant coelutions common to different types of Cannabis and was designed for laboratories interested in the quantification of minor cannabinoid and cannflavin constituents. Using this method, a total of 34 unique Cannabis analytes were quantified in less than 32 minutes. (Table 1). The method described has been successfully applied to not only leaf and flower Cannabis tissue, but cannabis/hemp products such as concentrates, oils, and cosmetic products.
Experimental
Sample Preparation
Air dried samples were milled to a powder using stainless steel ball-bearings with stems and seeds mechanically removed after pulverization. Between 0.2 and 0.5 grams of powder aliquots were solvent extracted in 10 mL of HPLC-grade acetone using ultrasonication for a total of 30 minutes, at a water temperature no greater than 35 °C. Sample extracts were syringe-filtered with 0.22 µm PTFE filters, followed by either a 2-fold dilution for leaf extracts or a 5-fold dilution for floral extracts.
Method
A Shimadzu Prominence-i LC-2030C Plus system, equipped with an Ascentis® Express C18 column and a photodiode array detector (PDA) was utilized to quantitate cannabinoid and cannflavin analytes in dried hemp tissues (Table 2).
Calibrations
Calibration standards were prepared gravimetrically from certified reference materials (CRMs) or research grade isolates for 34 unique cannabinoids and cannflavins at concentrations ranging from 0.1 to 800 µg/mL. The linearity for all compounds was R2 ≥ 0.99 using linear correlations and a best-fit weighting of 1/concentration. The UV spectra of each analyte was recorded in a spectral library to assist in positive identification of cannabinoids and cannflavins in plant tissue extracts.
Results and Discussion
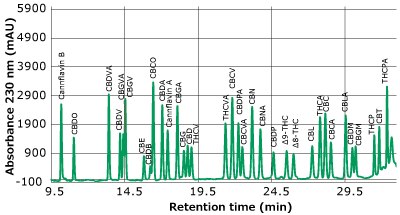
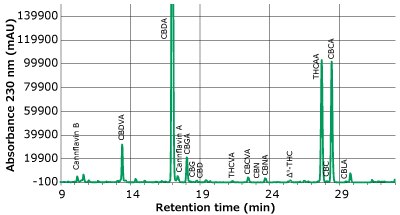
Separations of a cannabinoids/cannflavin standard and a hemp flower extract are presented in Figures 2A and B, showing the signal at 230 nm. By monitoring the multiple wavelengths described in Table 4, sufficient resolution was obtained for all peaks to allow for adequate identification and consistent integration. A solvent containing no analytes was applied to all standards and samples for consistent baseline identification.

Figure 2a.Chromatogram of 34 cannabinoids/cannflavins at approximately 1 µg/mL. (Trace at 230 nm only shown)

Figure 2b.Chromatogram of mix of hemp flower acetone extracts at a total dilution of 50X. (Trace at 230 nm only shown)
Accuracy and Precision
Accuracy and precision were evaluated by spiking all 34 analytes onto homogenized low-cannabinoid producing Cannabis plant material (Table 5). The concentration of cannabinoids and cannaflavins present in non- spiked Cannabis plant material was subtracted from the observed concentrations in the spiked samples. To further evaluate the method’s accuracy and precision, performance test (PT) samples provided by Merck were diluted by 5X and analyzed (Table 6).
Limits of Detection
Determined Limits of Detection (LOD) as S/N > 3 by weight percent are shown in Table 7.
Conclusions
A gradient HPLC method was developed for the quantification of 34 unique compounds in Cannabis within a single injection. Solvent consumption per injection was less than 16 mL with an injection-to- injection runtime of 35 minutes. The method described allows for the quantitation of major and minor phytocannabinoids in Cannabis with minimal coelutions from flavonoids or terpenes; thus, reducing limits of detection while maintaining accuracy at ≤ ±20% and precision at ≤ ±10%.
HPLC, Solvents & Reagents, Sample Preparation
Reference Materials (Neutrals & Cannflavin)
Reference Materials (Acids)
如要继续阅读,请登录或创建帐户。
暂无帐户?