Optimizing for High Throughput Analysis of Cannabinoids in a Variety of Matrices Using Ascentis® Express C18 Column
Seamus Riordan-Short, Senior Chemist1, Yevgen Kovalenko, Technician1, Matthew Noestheden, Director of Operations1, Jennifer King, Program Marketing Manager2, Katherine K. Stenerson, Analytical Sciences Liaison2
1Supra Research and Development, 2Merck
With increasing cannabis and hemp legislation, there has been increased demand for development and validation of accurate and precise testing methods for potency quantitation. Cannabinoids present a number of challenges, and there is also the additional burden of dealing with a variety of matrix types. HPLC/UV is the technique most commonly used, and the HPLC parameters must be optimized to maintain good separation and stable retention over many injections and with the various sample types.
Scientists at Supra Research and Development (“SupraRnD”) located in Kelowna, British Columbia, Canada (www.suprarnd.ca) have developed a high throughput and reliable method for cannabinoids that is applicable to a variety of matrices. SupraRnd’s involvement in cannabis testing began in 2015 when they obtained a license from Health Canada for testing cannabis products. In 2018 they were one of the first laboratories in Canada to obtain their ISO 17025 accreditation for cannabis testing. Their potency method has evolved over time to meet the changing needs of their customers and is now validated for several different matrices.
Experimental Conditions
Whole flower samples were frozen in hermetically sealed bags at -80 °C for a minimum of 30 minutes and then homogenized immediately.* It is critical that a representative sample is homogenized and subsampled when analyzing cannabis flower, as there can be considerable variance in phytocannabinoid concentrations between and within a given plant. The subsequent workflow involved a simple extraction of a 0.2 g sample size with methanol, followed by sonication and stabilization of the extract at -20 °C for 1 hour. The sample was then centrifuged, and the supernatant diluted 100:1 for HPLC analysis. The small sample size in combination with the pre-analysis dilution minimizes the potential for matrix-related issues (e.g., interferences, column longevity, etc.). The HPLC portion of the analysis has a cycle time of 8 minutes injection to injection. This allows 60 injections per 8-hour interval, which enables more customer samples to be run in a work shift. The cannabinoids analyzed by the method are listed in Table 1.
HPLC Analysis of Cannabinoids
The final, optimized HPLC parameters are summarized in Table 2.
When developing this method, the following were considerations:
- Chromatographic resolution of all 17 compounds.
- Cycle time (i.e., run time plus equilibration) of less than 10 minutes total.
- A rugged method with consistent performance for
- >1000 injections with stable retention times, while maintaining good peak shape and response.
- Suitable for use with different matrices such as flower, chocolate, ointment, oil, concentrate, etc.
Method Calibration
Calibration for the method was from 0.01 µg/mL to 40 µg/mL. This required a high dilution for some samples in order to bring them within this analytical range. For calibration and spiking, Cerilliant® certified reference materials (CRMs) were used. Individual cannabinoid CRMs at 1 mg/mL (with the exception of CBLA at 0.5 mg/mL) were diluted, along with the internal standard solution, directly into HPLC mobile phase component A, to prepare a 17-component stock solution at 40 µg/ mL. This stock was then diluted further into a 30:70 mixture of HPLC mobile phases A:B, for the lower concentration calibration standards.
HPLC Column: Ascentis® Express C18
The HPLC column used for the analysis was an Ascentis® Express C18 column, 15 cm x 2.1 mm I.D., 2 µm. Ascentis® Express columns contain Fused-Core® particles with a solid core and porous shell architecture, also referred to as superficially porous. This particle structure provides higher separation efficiency than fully porous particles of the same size and allows for faster analysis times with lower backpressure than approaches using smaller (< 2 µm) fully porous particles. The particle architecture of Ascentis® Express columns allows the use of larger particles, making them suitable for both conventional and UHPLC systems. For this method, SupraRnD used a UHPLC system, although with the proper instrument optimization, successful separation can be obtained on conventional systems as well. Specifically, this would involve minimization of system dispersion. This can be done by reducing tubing length and ID at the column inlet and outlet, and for UV detectors, using a flow cell with a volume of < 5 µL.
Method Validation and Performance
Prior to choosing the Ascentis® Express C18 for method validation, SupraRnD screened six other columns of similar chemistry from various manufacturers. They were able to achieve chromatographic resolution and a short run time with several columns but found that the Ascentis® Express C18 was the only column that provided retention time stability – especially for the acidic cannabinoids. This is illustrated in Figure 1 which shows chromatograms of a check standard at injection #1 and injection #1140, in between which numerous sample extracts were run.
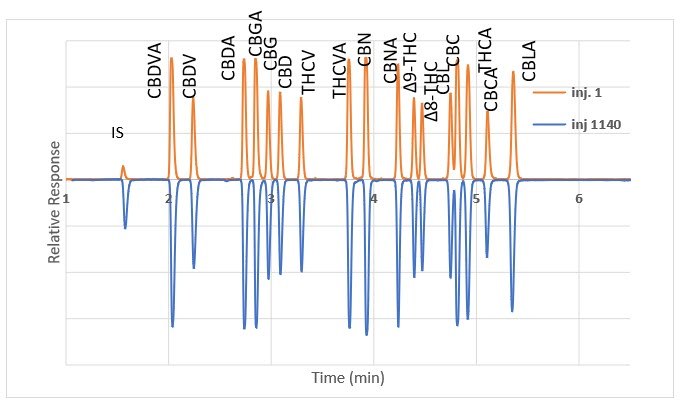
Figure 1.Cannabinoid standard on Ascentis® Express C18 column; comparison of injection #1 and injection #1140.
The method using the Ascentis® Express C18 was validated in several different matrices including hop flowers (as a surrogate matrix to cannabis), hemp seed oil, CBD concentrate, and topical ointments. Recoveries from hops ranged from 85-115% over a spiking range of 0.05 to 20% by weight. A summary of this validation, as well as the other matrices, is summarized in Table 3. The method reporting limits (MRLs) achieved for the cannabinoids (except for CBDV, CBG, CBD and CBC in the concentrate) were all 0.05 wt.%. Repeatability, as % RSD, was < 4% for all matrices. Further evaluation was done using proficiency testing in which the method successfully passed for samples of cannabis flower and hemp oil.
*CBD recovery not quantitated due to high incurred levels
**Δ9-THC recovery not quantitated due to high incurred levels
ŦCBDV, CBG, CBD, CBC incurred in matrix led to issues preventing calculation of MRL for these compounds
Figure 2 shows example chromatograms of hop flowers spiked at 1% w/w and at the MRL concentration of 0.05% w/w. At the much lower spiking level, where matrix interference was more apparent, all 17 cannabinoids were discernable from background peaks and could be analyzed. The specific interferences eluting next to THCV and CBL were probably due to specific terpenes present in the hop sample. These peaks were not observed in cannabis flower. In a spiked ointment sample (Figure 3), all cannabinoids were clearly detected at the MRL.
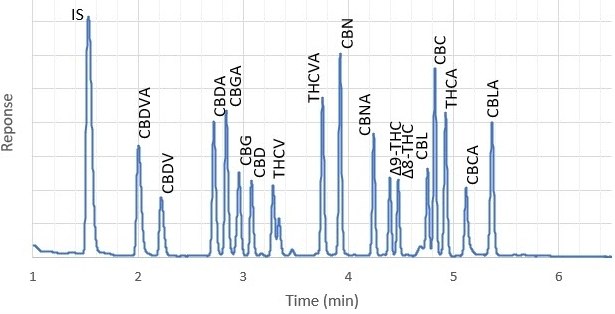
Figure 2.Hop flowers, spiked at 1% with cannabinoids.
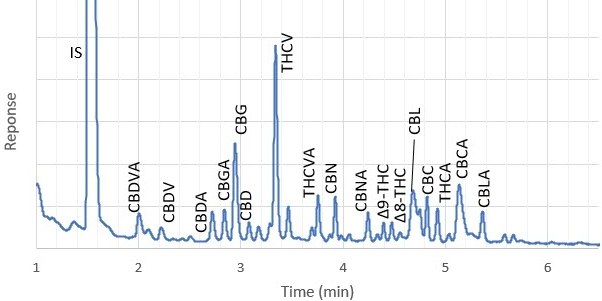
Hop flowers, spiked at 0.05% with cannabinoids.
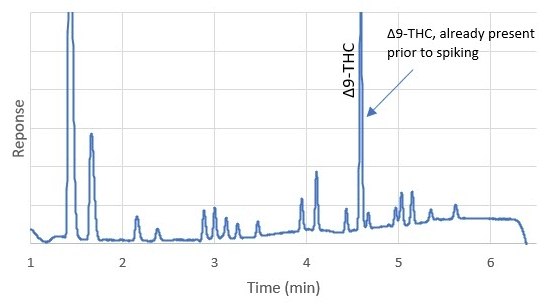
Figure 3.Ointment made from cannabis extract, spiked at 0.05% by weight.
To date, > 1,550 injections have been made on a single Ascentis® Express C18 column. SupraRnD has noted that thus far there has been no significant increase in column backpressure, or degradation in performance. Data collected on backpressure over the course of this use, showed a net increase of 2%. They also noted that retention times were stable, allowing them to identify cannabinoid peaks in samples with more confidence. An example is illustrated in Figure 4 in which two different matrices, dark chocolate and cannabis flower, are compared. Both samples contained measurable amounts of Δ9-THC, and the difference in the retention time between the two matrices were minimal.
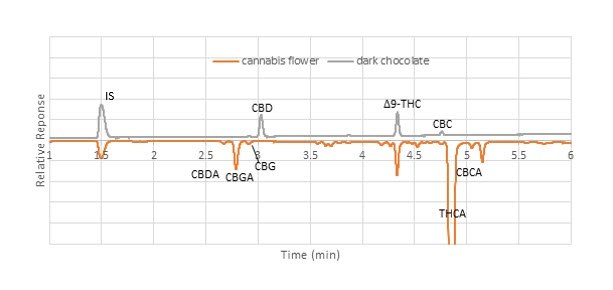
Figure 4.Comparison of elution pattern between dark chocolate and cannabis flower samples (unspiked).
Conclusion
After evaluating several HPLC columns, SupraRnD has successfully developed a robust and rugged method using the Ascentis® Express C18 column for the analysis of 17 cannabinoids in a variety of matrices. Thus far, the method has been successfully applied to five different sample types including flower, ointments, chocolate, concentrates and gummies. The Ascentis® Express C18 column was chosen for the final method based on retention time stability over repeated use, and ability to maintain chromatographic performance for the cannabinoids. In addition, the column currently in use has shown minimal increase in backpressure over the course of > 1500 injections.
* After publication of this data SupraRnD later removed the freezing step and homogenized the whole flowers at room temperature. This was done to reduce the possibility of inflating the moisture content through condensation of atmospheric water onto the cold samples.
Products
Certified Reference Materials
SOLVENTS & REAGENTS
Accessories
To continue reading please sign in or create an account.
Don't Have An Account?