Workflow for Pesticide Analysis in Cannabis
Geoffrey Rule, Ph.D., Rafael Acosta, Chris Leija, Ph.D., Romana Rigger, Ph.D., Stephan Altmaier, Dr., Uma Sreenivasan, Ph.D.
Merck
Introduction: Analysis of Pesticides in Cannabis
Recreational cannabis use has been legalized in 11 states and the District of Columbia with an additional 22 states allowing the use of medical marijuana.
This has led to mandatory testing for growers and processors of cannabis, and its derivative products, to show product safety according to the requirements of individual states. One of the requirements includes the testing of cannabis flowers for the presence of pesticides. This technical article demonstrates the use of Supelco® analytical standards, instrument consumables, and reagents to analyze low levels of pesticides in cannabis and, in particular, the 66 pesticides required by the State of California.1
In this workflow we present:
- Complete details for the analysis of the California pesticides by GC-MS/MS and LC-MS/MS
- Step-by-step procedures for calibrator and sample preparation
- Methods for the evaluation of suppression and extraction recovery
- Instructions for the preparation and use of analyte protectants in GC-MS/MS

Sample Preparation
Standardization & Calibration
GC-MS/MS & LC-MS/MS Analysis
Consistent Results
Preparation of Sample and Calibration Standards
Preparation of Pesticide Standard Working Solution (WS)
Calibration curves can be prepared using either a blank matrix extract that has gone through the extraction procedure or pure solvent. They can also be prepared by “spiking” plant material with a pesticide working solution (WS) in order to best imitate an actual plant sample. It is often desirable to perform each of these types of calibration experiments for different purposes, and the schemes outlined are provided for this purpose. The sets of calibration standards are then used for the evaluation of suppression or enhancement effects and for determining extraction recovery with a set of plant samples spiked prior to extraction.
Procedure for Sample Preparation
Note: If preparing calibration standards in plant, Working Solutions can be added at step 1 or 3 above and as shown in Scheme I.
Preparation of Plant-Based Calibration Standards
Pre-Extraction Spiked Calibration Standards
- Working solution (WS1): 100 µg/mL combined pesticides in LC-MS grade acetonitrile
- Working solution (WS2): 10 µg/mL combined pesticides in LC-MS grade acetonitrile
- Working solution (WS3): 1 µg/mL combined pesticides in LC-MS grade acetonitrile
How to prepare calibration standard solution example:
To make Cal 9 add 50 µL of WS1 solution as shown in step 1 (or 3) of sample preparation instructions (shown in 2.2 above)
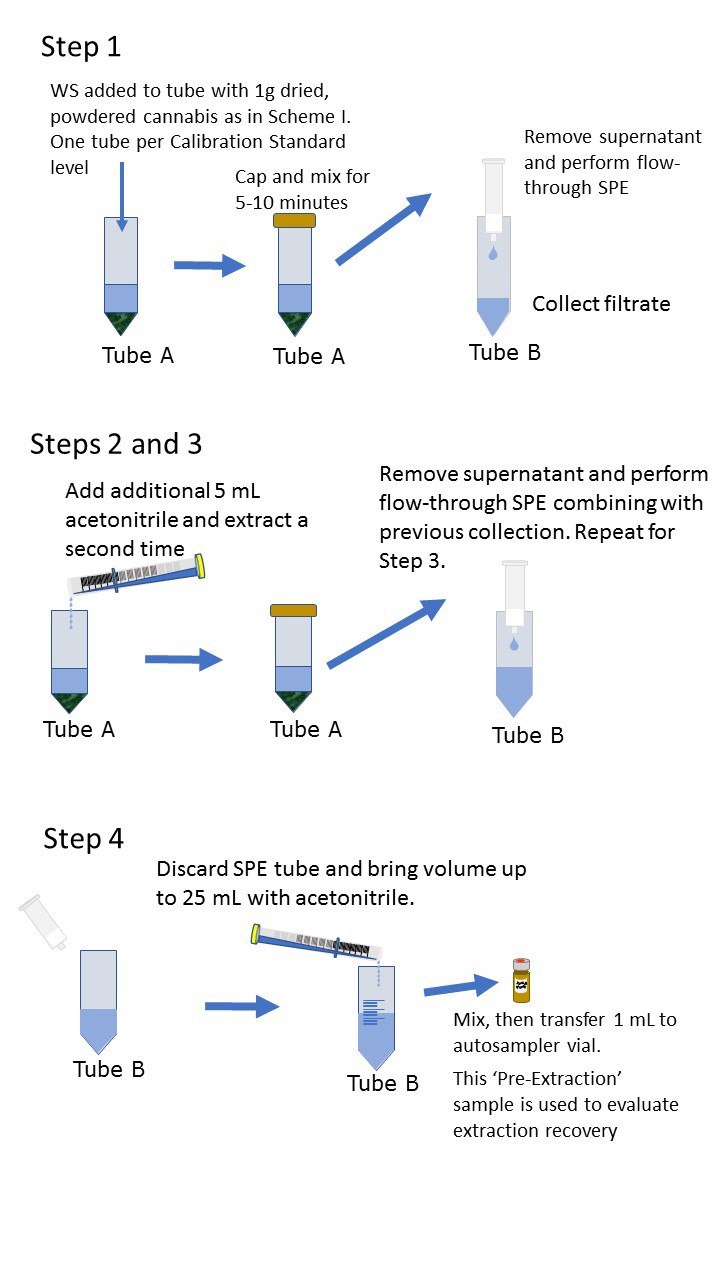
Scheme 1. Preparation of plant-based calibration standards; Pre-extraction spike
Post-Extraction Spiked and Solvent Calibration Standards
This scheme is used to prepare a set of calibration standards in either pure solvent or in a matrix extract that has been collected from blank, analyte free plant material
Working solution (WS2): 10 µg/mL Combined pesticides in LC-MS grade acetonitrile
- To make Cal 9 take 20 µL of WS2 solution and add 980 µL of blank matrix extract, or acetonitrile, in a 2 mL amber autosampler vial
- To make Cal 5 take 50 µL of Cal 9 solution and add 450 µL of blank matrix extract, or acetonitrile, in a 2 mL amber autosampler vial
- To make Cal 1 take 50 µL of Cal 4 solution and add 450 µL of blank matrix extract, or acetonitrile, in a 2 mL amber autosampler vial
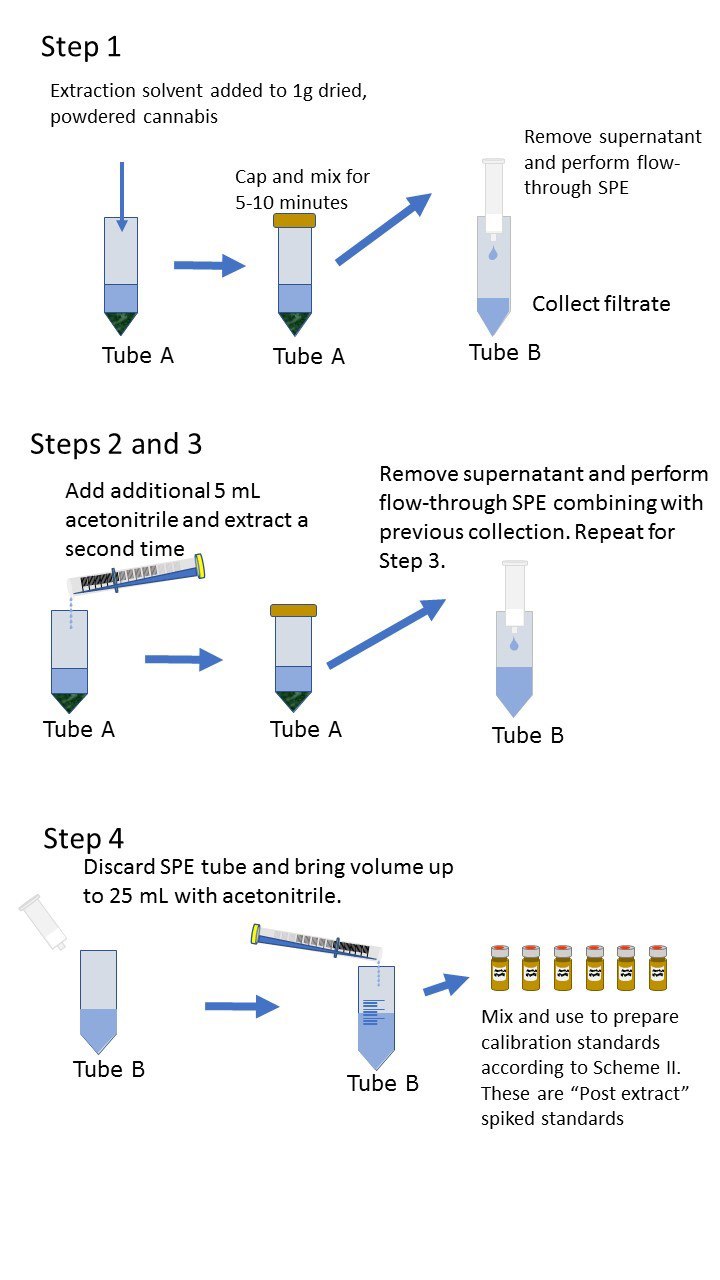
Scheme 2.Preparation of plant-based calibration standards; Post-extraction spike
3 Evaluation of suppression and extraction recovery using pre-extraction, post-extraction, and solvent standards
An ideal calibration curve is generated using a set of calibration standards prepared in pure acetonitrile and against which the suppression/enhancement and extraction recovery studies are performed. The calibration standards are prepared as shown in scheme II.
To evaluate suppression and enhancement effects a set of calibrators are prepared from a “post-extraction” sample, as shown in scheme II. For this preparation, a “blank” or “control matrix” of analyte free cannabis is taken through the sample preparation procedure before adding the pesticide working solution. A comparison of the “post extract” regression (calibration curve) with the regression performed in pure acetonitrile allows the evaluation of either suppression or enhancement effects.
Note that suppression or enhancement effects can occur with both GC-MS and LC-MS instrumentation although the causes are somewhat different. The study of these effects can provide insight into possible remedies that may be used to improve assay performance.
To evaluate “extraction recovery” a set of plant-based calibration standards is prepared as shown in Scheme I. This set of standards is spiked with a working solution and then taken through the sample preparation procedure. A comparison of these calibrators with those prepared from the “Post-extraction” set allows for the evaluation of extraction recovery or losses that occur during the extraction procedure.
Matrix Enhancement, Suppression, and Recovery Evaluation
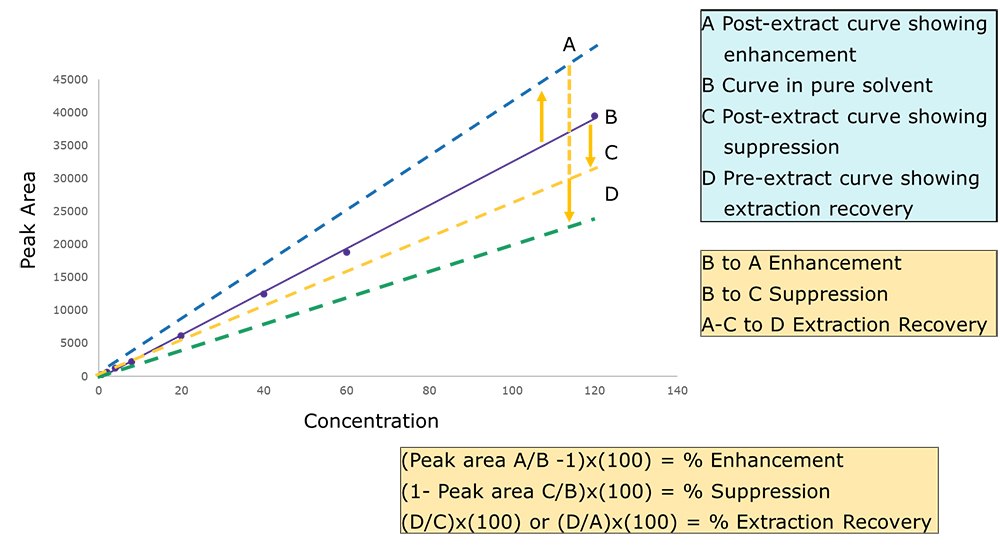
Complete workflow for LC-MS/MS analysis
Mobile phase preparation
Chromatographic and MS Conditions
Standard Injection of Pesticides in Hemp Extract
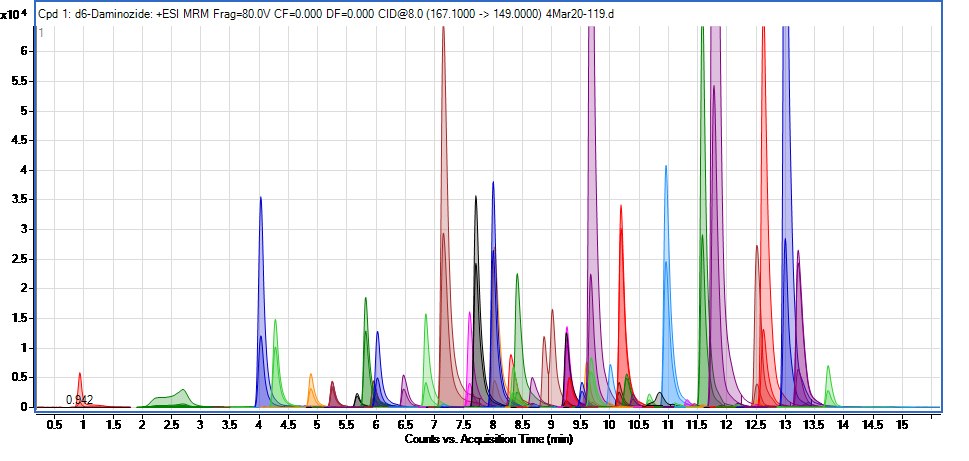
Acquisition Parameters for LC-MS/MS Amenable Pesticides in the California List:
HPLC Gradient
MS Parameters
Acquisition Parameters for LC-MS/MS Amenable Pesticides in the California List:
‡ As Mevinphos I
‡‡ as Pyrethrin II
* as Spinetoram J
**as Spinosyn A
Consistent Results
Tabulated Results for LC-MS/MS Amenable Pesticides in the California List:
ǂ As Mevinphos I
ǂǂ as Pyrethrin II
* as Spinetoram J
**as Spinosyn A
Complete Workflow for the GC-MS/MS Analysis
Preparation of Analyte Protectant Solutions
Analyte protectants reduce active sites in the GC inlet and sample-path to ensure reproducible and consistent results when analyzing pesticides at low ppb levels.2,3
GC-MS/MS Instrument Conditions
Acquisition Parameters for GC-MS/MS Amenable Pesticides in California List:
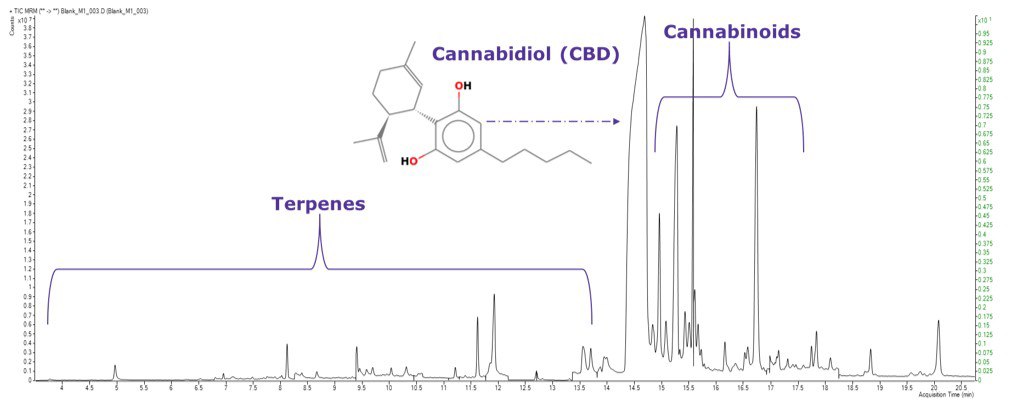
TIC MRM Chromatogram of GC-MS/MS Amenable Pesticides in California List Blank Sample Extract
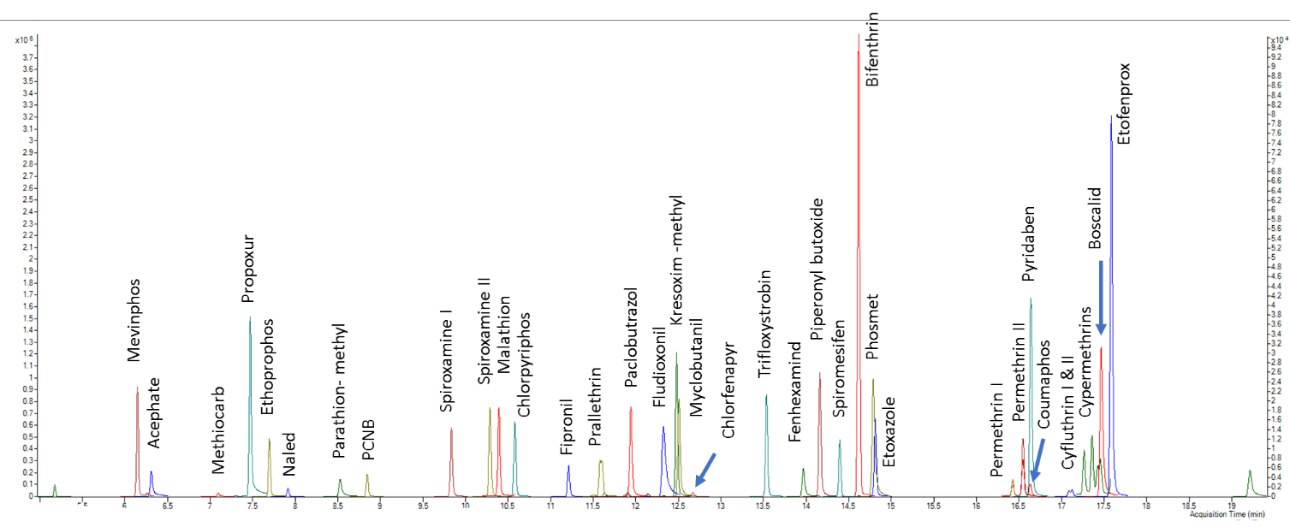
MRM Extracted Chromatogram of GC-MS/MS Amenable Pesticides in the California List - Standard at 200 ppb
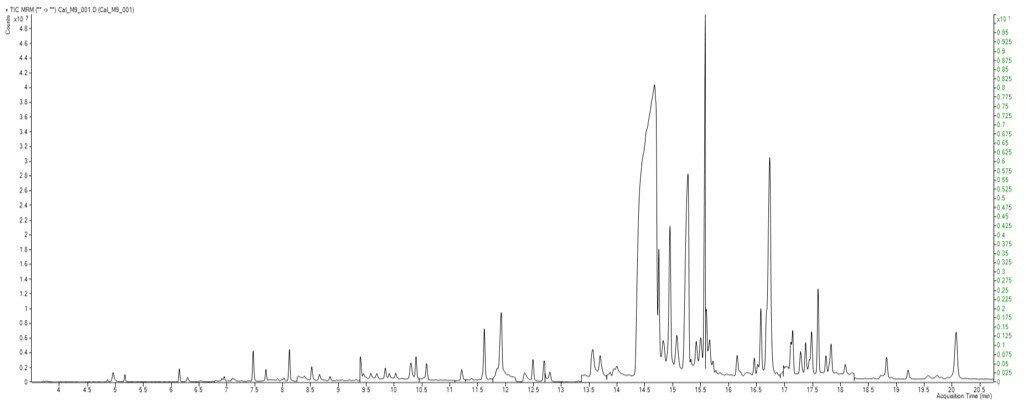
TIC MRM Chromatogram of GC-MS/MS Amenable Pesticides in the California List - Standard at 200 ppb
Consistent Results
Tabulated Results for GC-MS/MS Amenable Pesticides in California List:
Tabulated Results for All the Pesticides in the California List:
MAL: Minimum Action Level
Conclusion: Viable method to Quantify Pesticides in Cannabis Using Both LC-MS/MS and GC-MS/MS
A method has been developed to quantify the California list of pesticides from dried cannabis, as per the state requirements, by using a combination of both LC-MS/MS and GC-MS/MS. A single flow through solid-phase extraction is used to prepare the samples for both instrumental techniques. Linearity, recovery, and precision are demonstrated using dried hemp, and schemes for performing the calibration, extraction recovery, and suppression/ enhancement studies are provided.
A total of 57 pesticides are reported using LC-MS/MS and 40 using GC-MS/MS. Due to the high levels of interfering CBDA, acequinocyl was not detected at minimum levels with the existing instrumentation. All other pesticides are reported using one or the other analytical technique to meet or exceed the current California regulatory limits for each category.
As seen from the illustrations and results, the use of Supelco® chromatography solvents, consumables, supplies, and analytical reagents in combination with GC-MS/MS and LC-MS/MS instrumentation provides an efficient way to analyze cannabis for the presence of pesticides. The minimum action levels of 0.1 µg/g (100 ppb) for California are easily achievable for most of the compounds. Obtaining consumables and reagents from one supplier ensures that the time is well spent in analyzing samples rather than evaluating multiple sources for analytical supplies.
The GC-MS/MS instrumentation is used here as a supplement to LC-MS/MS in order to detect all California cannabis pesticides at their required minimum action levels. Millipore Sigma does not endorse any particular instrumentation and aims to provide solutions for sample preparations and chromatographic challenges of laboratories regardless of the instrument used.
Conclusion
In this workflow we have presented:
- Complete details for the analysis of the California pesticides by GC-MS/MS and LC-MS/MS
- Step-by-step procedures for calibrator and sample preparation
- Methods for the evaluation of suppression and extraction recovery
- Instructions for the preparation and use of analyte protectants in GC-MS/MS
Approaches for Further Resolution Gains
This work was a continuation of our earlier studies examining the Oregon list of pesticides. It offers a solution for the issue of poor peak shape of weakly retained, early eluting analytes. However, there are other options available that may permit the use of our Ascentis® Express Fused-Core® columns to provide overall better peak shape and resolution. The issue for early eluting analytes is the high solvent strength of the sample following extraction, versus the solvent strength of the initial mobile phase. The approach taken here was to use a guard column to insert a porous bed into the flow path to provide a space for sample mixing with the solvent. This same approach can be used with our Fused-Core® column technology.
Approaches That Can Be Explored to Leverage the Fused-Core® Technology:
- Coupling a high-resolution Ascentis Express analytical column with a porous particle guard column of lower hydrophobicity of which there are several options available.
- Sample dilution with a small amount of water. This would entail trying a series of dilutions to determine which affords desirable improvement in the shape of early eluting peaks. In order to keep sample mass constant, the sample volume would need to be increased by the same factor as used in dilution. Additionally, be mindful of issues around analyte solubility as cannabinoids could precipitate out of solution. Utilizing more sensitive LC/MS/MS detection can also permit smaller sample volumes which can ameliorate the problem.
See also the Article in Analytix Reporter Issue 10 for more information on the infusion experiments determine in signal suppression.
Materials
References
如要继续阅读,请登录或创建帐户。
暂无帐户?