Fluorescent Live Cell Imaging of LC3 Mediated Autophagy using LentiBrite™ Lentiviral Biosensors
Introduction
Autophagy, a degradative pathway that provides recycled nutrients to cells under stress, plays both protective and deleterious roles in many diseases, including cancer, neurodegeneration, and infections. Members of the LC3 family play a key role in the maturation of the autophagosome, the central organelle of autophagy. LC3 precursors, diffusely distributed in the cytosol, are proteolytically processed to form LC3-I. Upon initiation of autophagy, the C-terminal glycine is modified by addition of a phosphatidylethanolamine to form LC3-II, which translocate rapidly to nascent autophagosomes in a punctate distribution. DNA constructs encoding fluorescent proteins fused to LC3 are widely employed for introduction into cells for monitoring autophagosome formation by fluorescence microscopy.
We utilized LentiBrite™ lentiviral biosensors to visualize autophagy, in which TagGFP2 and TagRFP are fused at their C-termini to the autophagosome marker LC3. LC3 precursors, diffusely distributed in the cytosol, are proteolytically processed to form LC3-I. Upon initiation of autophagy, the C-terminal glycine is modified by addition of a phosphatidylethanolamine to form LC3-II, which translocates rapidly to nascent autophagosomes in a punctate distribution. Our LentiBrite™ GFP-LC3, GFP-LC3 Control Mutant, and RFP-LC3 lentiviral particles provide bright fluorescence and precise localization of LC3 to the autophagosome, enabling live cell analysis of autophagy even in difficult-to-transfect cell types.
See LentiBrite™ Live Cell Videos
Methods
Construction of lentiviral vectors encoding fluorescent protein fusions
LentiBrite™ GFP-LC3, RFP-LC3, and GFP-LC3 Control Mutant Lentiviral Biosensors were constructed as follows: the cDNAs encoding TagGFP2 and TagRFP were obtained (Evrogen) and the cDNA encoding human LC3A residues 1-120, which represents the proteolytically processed, mature form of LC3A, was cloned in-frame at the 3’ end of the fluorescent protein cDNA. The resulting fusion proteins, TagGFP2-LC3 and TagRFP-LC3, leave the C-terminal glycine (Gly120) of LC3 available for lipidation upon induction of autophagy. To generate a control mutant that does not translocate upon induction of autophagy, site-directed mutagenesis was employed to mutate LC3 Gly120 to alanine, which renders the protein refractory to lipidation. Constructs were transferred to pCDH-EF1-MCS, a lentiviral vector containing the constitutive, moderately expressing EF1α promoter. 3rd generation HIV-based VSV-G pseudotyped lentiviral particles were generated using the pPACKH1 Lentivector Packaging System.
Cell seeding and lentiviral transduction
Cells in growth medium were seeded onto 8-well glass chamber slides for fixed and live cell imaging. Seeding densities were selected to provide for 50-70% confluency after overnight culture (e.g., 20,000-40,000 cells/cm2). The next day after seeding, medium was replaced with fresh growth medium. High-titer lentiviral stock was diluted 1:40 with growth medium, and appropriate volumes of lentivirus were added to the seeded cells to achieve the desired multiplicity of infection (MOI). MOI refers to the ratio of the number of infectious lentiviral particles to the number of cells being infected. Typical MOI values ranged from 10 to 40. Infected cells were then incubated at 37 °C, 5% CO2 for 24 h. 24 h after lentiviral transduction, lentivirus-containing medium was removed and replaced with fresh growth medium. Cells were cultured for another 24-48 h, with media changed every 24 hours. For inhibitor experiments, cells were incubated in the inhibitor of interest at the concentration and for the time indicated in the legend.
Live cell imaging and antibody staining
For live cell visualization, the growth medium was replaced with Dulbecco’s Modified Eagle Medium (DMEM) containing 10% fetal bovine serum (FBS) and 25 mM HEPES. The chambered cover glass was placed in a temperature-controlled microscope stage insert upon a Leica DMI6000B inverted wide-field fluorescent microscope with a 63X oil-immersion objective lens and illumination/filters appropriate for GFP or RFP visualization. Imaging was initiated as rapidly as possible following the addition of modulators.
For end-point imaging, cells in chamber slides were fixed for 30 minutes at room temperature with 3.7% formaldehyde in Dulbecco’s phosphate-buffered saline (DPBS). During fixation and for all subsequent steps, cells were protected from light to minimize photobleaching. Samples were then rinsed twice with fluorescent staining buffer (DPBS with 2% blocking serum and 0.25% Triton® X-100). Primary antibody in fluorescent staining buffer was added to each well and incubated 1h at room temperature. Samples were then rinsed three times with fluorescent staining buffer before incubation for 1h at room temperature with fluorescent secondary antibody and DAPI (1 μg/mL) in staining buffer. Finally, samples were rinsed twice each with fluorescent staining buffer and DPBS, and slides were coverslipped with mounting medium containing anti-fade reagent and cover glasses.
Analysis of GFP-LC3 localization by flow cytometry
The LentiBrite™ Autophagosome Enrichment Kit was employed for analysis of autophagosome formation in primary cells. Human umbilical vein endothelial cells (HUVEC) were incubated with lentivirus encoding TagGFP2-LC3 or TagGFP2-LC3G120A (control mutant) at an MOI of 40 for 24 hrs. After removal of the lentivirus, the cells were cultured for an additional 48 hrs. Cells were either left in complete growth medium or incubated in EBSS containing a lysosomal inhibitor, and were subsequently detached with Accutase™ and permeabilized. U2OS cells stably expressing TagGFP2-LC3 (FlowCellect™ GFP-LC3 Reporter Autophagy Assay Kit), were treated in parallel as a positive control. Samples were analyzed immediately on a guava easyCyte™ 8HT flow cytometer.
Results
Improved biosensor expression efficiency with lentiviral transduction
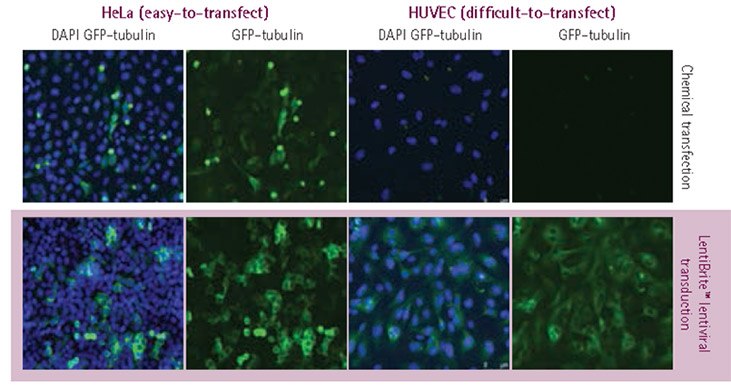
We constructed a panel of lentiviral particles containing genetically encoded fluorescent markers. By using these lentiviral biosensors, both transfection efficiency and homogeneity were greatly improved relative to chemical transfection with plasmid DNA (Figure 1).

Figure 1.Plasmid vs. lentivirus transfection in easy- and difficult-to-transfect cell types. HeLa cells and HUVECs were transfected with a TagGFP2-tubulin-encoding construct, either utilizing plasmid DNA in conjunction with a lipid-based chemical transfection reagent, or using LentiBrite™ lentiviral particles. Images were obtained via wide-field fluorescent imaging with a 20X objective lens (blue = DAPI nuclear counterstain, green = GFP-tubulin). Lentiviral transduction resulted in higher transfection efficiency (particularly for HUVEC, for which plasmid transfection was unsuccessful) and GFP-tubulin signal of more uniform fluorescence intensity.
Specificity and localization of lentivirally delivered GFP-LC3
To compare localization patterns of genetically-encoded fluorescent proteins with antibody-based immunofluorescence, HeLa cells were lentivirally transduced with GFP-LC3. GFP-LC3-expressing cells were either left untreated, or subjected to starvation conditions to induce autophagy by incubation in EBSS. Both the fluorescent protein and anti-LC3 antibody displayed diffuse nuclear and cytoplasmic signal under fed conditions and a punctate distribution following starvation.

Figure 2.GFP-LC3 fluorescent signal (green) co-localizes with signal from fluorescent staining using LC3 antibody (red). HeLa cells were-transduced with TagGFP2-LC3, and 72 hrs later, either left in growth medium or starved for 4 hours in EBSS with a lysosomal inhibitor. Cells were subsequently fixed, immunostained, and imaged by wide-field microscopy. Starved, autophagic cells displayed punctate cytoplasmic LC3 distribution, in contrast to diffuse nuclear and cytoplasmic localization under fed conditions. Fluorescently tagged protein co-localized with staining obtained with anti-LC3

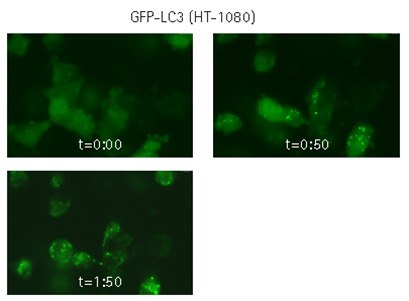
Figure 3.Live cell time-lapse imaging of lentivirally-transduced cells. HT-1080 cells were lentivirally transduced with TagGFP2-LC3, and imaged by oil-immersion wide-field microscopy in real-time. The cells were starved in the presence of a lysosome inhibitor, and imaging was immediately initiated, with images obtained every minute for 2 hours. Still-frame captures demonstrate formation of GFP-LC3-positive discrete cytoplasmic punctae.

Figure 4.Autophagy inhibitor 3-MA prevents translocation of GFP-LC3. HT-1080 cells were lentivirally-transduced with TagGFP2-LC3 wild-type (GFP-LC3 wt) or TagGFP2-LC3G120A (GFP-LC3 mutant) at MOI of 20. Transduced cells were either left in growth medium, or starved in EBSS with lysosome inhibitor in the presence or absence of 3-methyladenine (3-MA). Cells were fixed, mounted, and imaged by wide-field fluorescence microscopy. Cells transduced with wild-type GFP-LC3 no longer exhibited cytoplasmic punctae under starvation conditions in the presence of 3-methyladenine. In addition, cells transduced with a negative control mutant GFP-LC3 maintained diffuse nuclear and cytosolic distribution under all conditions.

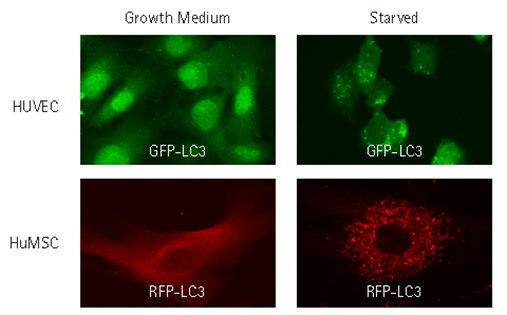
Figure 5.Lentiviral transduction enables analysis of autophagy in hard-to-transfect primary cell types. HUVEC and Human MSCs were lentivirally transduced at an MOI of 40 with TagGFP2-LC3 or TagRFP-LC3, and fed or starved as in Figure 2. Cells were then fixed and imaged by wide-field microscopy. The transduced fluorescent proteins displayed diffuse distribution in growth media and a punctate distribution following starvation-induced autophagy.

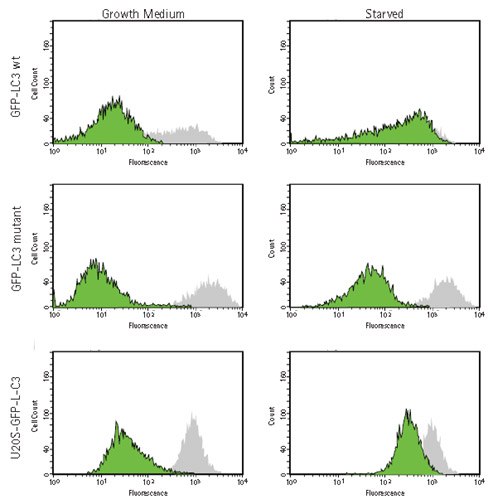
Figure 6.Analysis of GFP-LC3 localization in HUVEC by flow cytometry. HUVECs were lentivirally transduced with TagGFP2-LC3 wild-type (GFP-LC3 wt, top row) or TagGFP2-LC3G120A control mutant (GFP-LC3 mutant, center row). U2OS cells stably expressing TagGFP2-LC3 wild-type were also analyzed (U2OS-GFP-LC3, bottom row). Transduced cells were detached and either permeabilized to release free, cytosolic LC3 (green peaks) or left intact (gray peaks). After processing, the cells were analyzed by flow cytometry on a guava easyCyte™ 8HT instrument. Upon permeabilization, only TagGFP2-LC3 wild-type-expressing cells under starvation conditions display retention of the fusion protein, indicative of tight association of LC3 with autophagosomes.
Conclusion
LentiBrite™ lentiviral biosensors enable convenient transduction of easy- and hard-to-transfect cell types with fluorescently-tagged proteins of interest. These pre-packaged lentiviral particles provided higher efficiency of gene delivery and more homogeneous expression of introduced proteins compared to non-viral transfection methods. The data presented here demonstrates the utility of a GFP- or RFP-tagged autophagy marker, LC3, in both fixed and live cell microscopy applications. The encoded proteins displayed co-localization with antibody staining and appropriate redistribution upon treatment with known modulators of autophagy.
如要继续阅读,请登录或创建帐户。
暂无帐户?