Workflow and Analysis of Stressed and Unstressed Antibody Samples By Size Exclusion Chromatography
Stephan Altmaier1, Uma Sreenivasan2
1Darmstadt, Germany, 2Round Rock, TX, USA

Antibody & Standard Preparation
Antibody Stressing
Chromatography
Measurement & Analysis
ABSTRACT
A complete SEC-UV workflow has been developed to enable quantitative analysis of antibody fragments and aggregates. In detail, it includes:
- Procedure for heat stressing of antibodies
- System suitability test utilizing a gel filtration standard
- SEC-UV method for sample separation and analysis
INTRODUCTION TO THERAPEUTIC mAb CHARACTERIZATION
Monoclonal antibodies (mAbs or immunoglobulins - IgGs) are large glycoproteins with a molecular weight of approximately 150 kDa (150,000 g/mol). These biomolecules are composed of two light chains (LC, molecular weight ca. 25 kDa each) and two heavy chains (HC, molecular weight ca. 50 kDa each) linked through covalent inter- and intra-chain disulfide bonds. IgGs are utilized for the treatment of various types of cancer and other diseases such as multiple sclerosis, Alzheimer’s disease, and migraine.
Careful and thorough characterization of therapeutic mAbs is essential for ensuring drug safety and efficacy. MAbs are typically manufactured in mammalian host cell lines in bioreactors, generating many heterogeneous drug molecules. Establishing a number of critical quality attributes (CQAs) for each mAb and demonstrating that production batches are within acceptable limits are requirements for both innovator and biosimilar therapeutics.1,2
In many cases, the characterization of an antibody-based drug is performed using a specific chromatographic technique (e.g., size exclusion, reversed phase or hydrophilic interaction liquid chromatography, respectively – SEC, RP or HILIC)3,4 coupled with UV or mass spectrometry (MS) detection. This combination allows for different types of analyses to be carried out, e.g., accurate mass measurement of aggregates,5 the intact mAb and subunits, fragment analysis, peptide mapping, and the determination of post-translational modifications such as glycosylation, oxidation, and deamidation. SEC is a frequently utilized method for the determination of mAb fragments and aggregates.
Monoclonal antibody formulations can undergo various degradation processes during production, formulation, transport and storage, leading to the formation of protein aggregates and fragments - impurities that are CQAs and that must stay within specific limits. Typically, the total amount of impurities (high and low molecular weight - HMW/LMW) is required to be below 5% and no individual peak area should exceed 1-2%. Usually, the concentration of aggregates in a mAb formulation is higher than the fragment concentration and ranges from 1-5%. Specific limits are validated based on holistic characterization data or on stability trends.
During aggregation, two or more mAb monomers form a stable complex, a process that is difficult to reverse. This aggregation can be induced by electrostatic interactions, for example, leading to self-association of mAbs in concentrated formulations. Another pathway for aggregate formation is misfolding or (partial) unfolding of antibodies creating hydrophobic regions which subsequently bind to each other. Chemical reactions such as disulfide bonding of thiol groups can also form mAb aggregates. Depending on the process, reversible and irreversible covalent and non-covalent species of different sizes can be observed.
Factors influencing aggregation can include temperature, pH value, shear stress during shaking or stirring, or exposure to light or hydrophobic surfaces.6
Fragmentation of mAbs can be described as the chemically or enzymatically induced disruption of a covalent protein bond.7 In the same manner as aggregation, fragmentation is a CQA that needs to be monitored.
An inactivation of a mAb by irreversible fragmentation reactions is most frequently caused by temperature, pH or mAb concentration or the presence of enzymes, metals, or radicals.
The presence of aggregates or fragments in antibody formulations is considered a paramount issue, since they can cause effects such as decreased or increased activity, increased cytotoxicity and immunogenicity and decreased solubility of the drug.8 More specifically, side effects such as headache, shivers, anaphylactic reactions or renal failure have been observed9 as well as the development of an immune response by patients. In such a situation, the effectiveness of a drug is strongly reduced.10 Hence, it is essential to characterize mAb aggregate and fragment formation during drug formulation and to establish a suitable quality control process for these therapeutics.
The focus of this application note is to conduct forced temperature stress studies on a monoclonal antibody and to separate and quantify resulting aggregates and fragments as well as monomers by utilizing SEC-UV analysis.
Eluent Preparation
Add 38.1 g potassium di-hydrogen phosphate (KH2PO4), 21.1 g of di-potassium hydrogen phosphate (K2HPO4) and 37.3 g of potassium chloride (KCl) to a 2 L volumetric flask containing about 1.8 L water and mix thoroughly. Check pH (6.2 ± 0.1) and adjust, if needed, with 85% phosphoric acid (H3PO4) or 47% potassium hydroxide (KOH) under stirring. Fill up to 2 L with water and filter solution using a 0.2 μm bottle-top filter. Solution can be stored at 23 ± 5 °C for two weeks.
Sample Preparation
In this work, a research antibody was utilized as a model mAb and is referenced as “antibody”. The antibody sample was obtained as a formulation in 10 mM histidine (c = 21.6 mg/mL, pH 5.5).
- Blank Sample: Utilize undiluted eluent as a blank sample.
- Gel filtration standard solution (system suitability): Reconstitute one vial of a gel filtration standard (GFS; 1,350–670,000 Da; contains thyroglobulin, bovine γ-globulin, chicken ovalbumin, equine myoglobin, vitamin B12) with 0.5 mL water. Dilute 480 μL of reconstituted solution by adding 9.12 mL water. Dispense resulting solution in 200 μL aliquots in amber vials. Avoid direct light exposure of the vials (GFS contains vitamin B12 which is light sensitive). Store at -80 °C ± 5 °C and use within three years.
- Unstressed antibody sample solution: Dilute 93 µL of antibody sample solution with 907 µL eluent in amber vial to yield a final sample concentration of 2 mg/mL.
- Heat-stressed antibody sample solution: Stress 1 mL of antibody sample solution for 6 hours at 60 °C utilizing an Eppendorf Thermomixer (or equivalent). Dilute 93 µL of resulting sample solution with 907 µL eluent in amber vial to yield a final sample concentration of 2 mg/mL.
System Setup
The essential settings of the SEC-UV chromatography system applied in the analysis of antibody aggregates and fragments are listed in Table 1 below.
A typical sample injection scheme applied was as follows:
Data Analysis
For quantitative analysis of aggregates, monomers and fragments, all sample peaks that were not present in the blank were integrated; both automatic and manual integration approaches were applied.
RESULTS OF SEC-UV ANALYSIS OF UNSTRESSED AND HEAT-STRESSED ANTIBODIES
The analysis objective was to perform fragment and aggregate analysis of a research antibody by SEC-UV. The antibody sample was received as a formulation in 10 mM histidine and used without further treatment. Both unstressed as well as heat-stressed antibody samples were tested. In addition, a gel filtration standard was utilized to determine system suitability.
System Suitability Test Results
A volume of 10 µL of the gel filtration standard was injected on the SEC-UV system. The obtained chromatographic result is displayed in Figure 1. The chromatogram shows five peaks for thyroglobulin, bovine γ-globulin, chicken ovalbumin, equine myoglobin, and vitamin B12. In addition, thyroglobulin aggregate and fragment peaks are visible. Depending on the analytical needs, critical parameters such as the resolution or the plate count for specific peaks can be predefined (“acceptance criteria”).
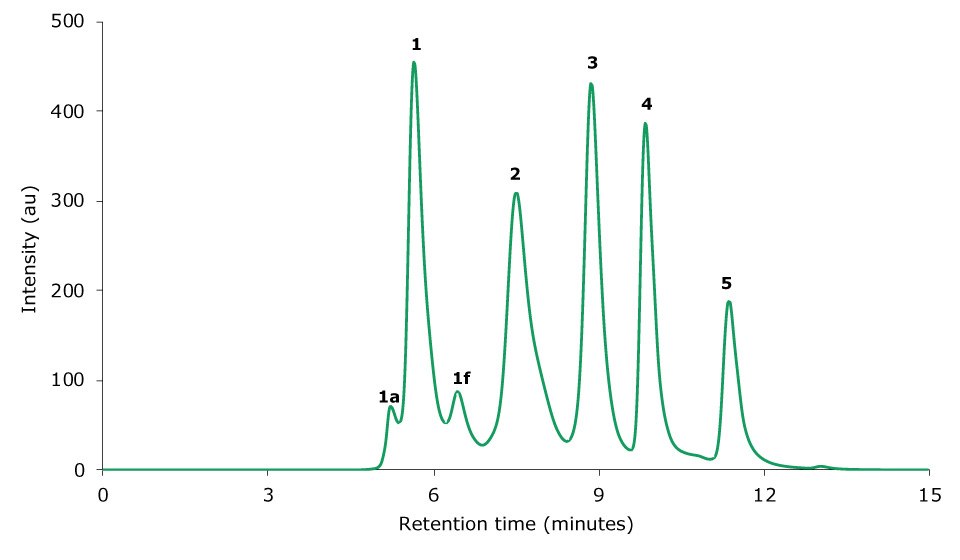
Figure 1.Chromatogram of a gel filtration standard obtained by SEC-UV analysis. 1 Thyroglobulin, 2 bovine γ-globulin, 3 chicken ovalbumin, 4 equine myoglobin, 5 vitamin B12. 1a and 1f are thyroglobulin aggregate and fragment peaks, respectively.
Sample Test Results – Unstressed Antibody Sample
The SEC-UV chromatogram of an overlay of six injections of 10 µL of an unstressed antibody sample is displayed in Figure 2. The monomer antibody elutes as the main peak at 7.40 minutes; minor amounts of antibody fragments and aggregates elute between 9.19 to 14.62 minutes and at 6.33 minutes, respectively.
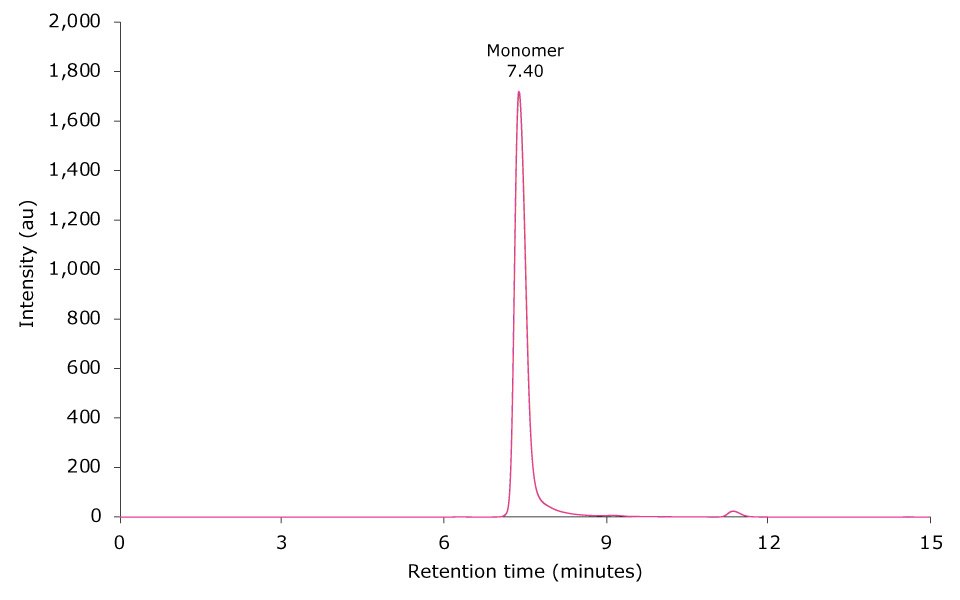
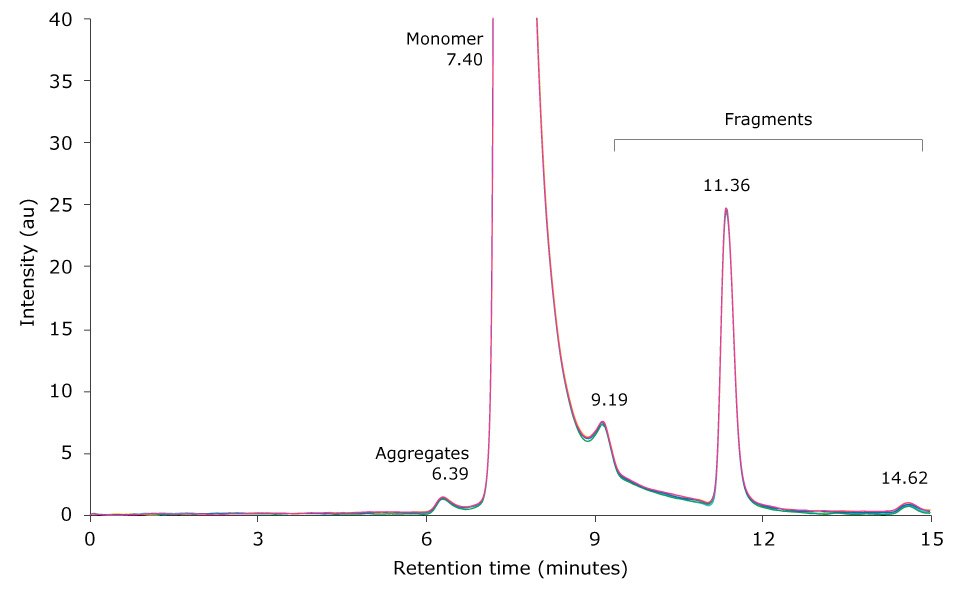
Figure 2.Overlay of SEC-UV traces of six consecutive runs of an unstressed mAb sample (top) and zoom-in (bottom).
The relative peak areas of six consecutive runs of an unstressed mAb sample are listed in Table 3. Median peak area for the monomer was determined at 92.378%, with the standard deviation (SD) being as low as 0.320. Respective values for HMW and LMW compounds were 0.138% (SD 0.004) and 7.485% (SD 0.321), respectively.
Sample Test Results – Heat-Stressed Antibody Samples
Heat-stressing of a research antibody sample was performed for 6 hours at 60 °C. 10 µL of the resulting sample was then injected on the SEC-UV system. Figure 3 displays an overlay of six injections of the stressed antibody. The monomer antibody elutes as the main peak at 7.40 minutes; several antibody fragment peaks are visible between 8 to 15 minutes, and aggregates elute between 4.5 to 7 minutes.
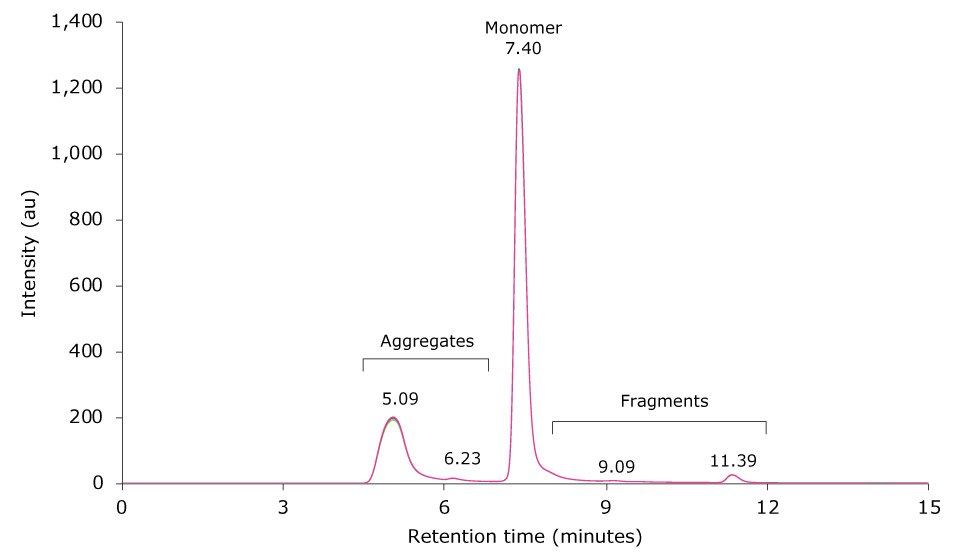
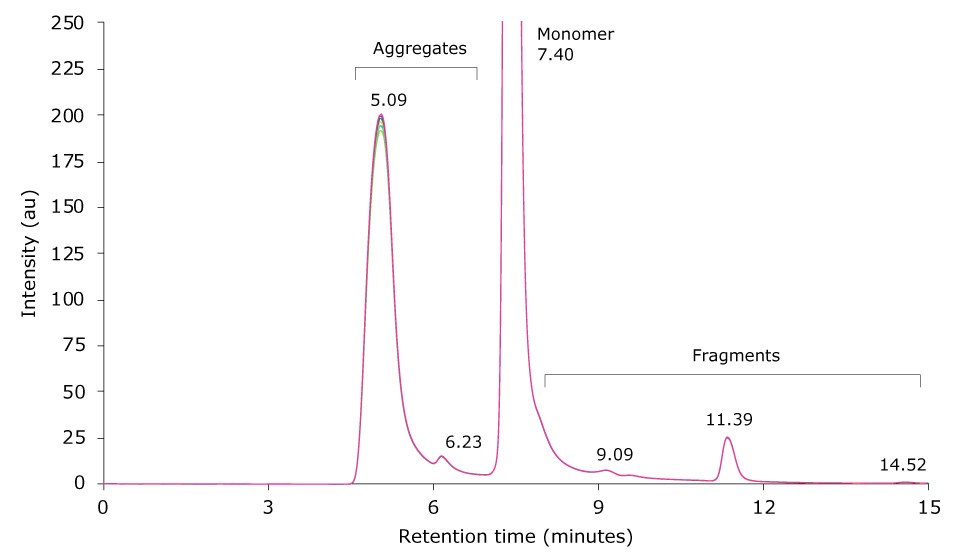
Figure 3.Overlay of SEC-UV traces of six consecutive runs of a mAb sample heat-stressed for 6 h at 60 °C (top) and zoom-in (bottom).
Table 4 shows the relative peak areas of six consecutive runs of the temperature-stressed mAb sample. Median peak area for the monomer, aggregates and fragments was 26.345%, 66.292% and 7.367%, respectively, and the corresponding standard deviations were 0.299, 0.312 and 0.033. Comparison of these results with the composition of the unstressed mAb sample revealed a negligible influence of temperature stress on the number of fragments detected. In contrast, monomer content dropped by approximately 26% and HMW content increased by the same amount.
Conclusion of SEC-UV Analysis of Antibody Aggregates, Monomers and Fragments
The objective of this work was to develop a workflow for the quantification of antibody aggregates, monomers, and fragments by SEC-UV.
The workflow was comprised of a system suitability test utilizing a gel filtration standard and a procedure for heat stressing of antibodies. In addition, a SEC-UV method suitable for sample separation and analysis of mAb monomers, fragments and aggregates was established.
The research antibody analyzed in this work underwent temperature stressing at 60 °C for 6 h. A comparison of SEC-UV chromatograms of unstressed and stressed antibody samples revealed a strong influence of temperature on the formation of several mAb aggregates. The unstressed antibody sample contained the monomer as the main component (peak area 92.4%), 7.5% of various fragment molecules and 0.1% of aggregate species.
Heat-stressing of the antibody sample was utilized to cause accelerated change of sample composition. The applied process led to a strong shift in sample composition: While monomer concentration dropped to 66.3% (peak area) and the monomer remained the predominant species, the aggregate fraction portion increased to 26.4% and the amount of fragments remained almost constant and was calculated at 7.4%.
The generated data displays that the implemented workflow can be used for the quantitative analysis of unstressed and temperature stressed antibody aggregates, monomers, and fragments by SEC-UV.
Materials
References
如要继续阅读,请登录或创建帐户。
暂无帐户?