Peptide Mapping LC-MS/MS Analysis Workflow for Adalimumab
Geoffrey Rule, PhD1, Pegah Jalili2, Uma Sreenivasan, PhD3, Kevin Ray, PhD2
1Bellefonte, PA, USA, 2St.Louis, MO, USA, 3Round Rock, TX, USA
Workflow for Peptide Mapping

A workflow has been developed to provide low artifact formation during the digestion of monoclonal antibodies. This workflow offers the following:
- Step-by-step instructions for the denaturation, reduction, alkylation, and digestion of protein samples
- Complete product list and details of filter assisted sample preparation (FASP)
- Low artifact digestion buffer (LADB) for minimizing deamidation and oxidation
- Chromatographic separation with mass spectrometric detection
1. Introduction
Careful and thorough characterization of therapeutic monoclonal antibodies (mAbs) is essential for ensuring product safety and efficacy. This assurance is achieved by establishing a number of critical quality attributes (CQAs) for each therapeutic protein, followed by demonstration that each batch of the material is found within acceptable limits. This strategy holds for both innovator therapeutics as well as biosimilars being considered for approval. In this application note, we perform an analysis of the innovator mAb Humira (adalimumab).
Peptide mapping, a bottom-up approach to protein characterization, enables the profiling of a protein’s primary structure as well as its post-translational modifications (PTMs) such as oxidation, deamidation, and glycosylation. The use of a high-resolution mass spectrometry-based approach for the characterization is commonly referred to as a multi-attribute method (MAM)1, as the peptide mapping analysis yields multiple pieces of information about the protein in a single analysis. This type of method is important for the comprehensive and accurate characterization of therapeutic proteins as it can yield both qualitative and quantitative information. In addition, minimizing protein degradation during sample preparation, such as amino acid oxidation and deamidation, is also crucial in obtaining an accurate depiction of the therapeutic protein.2
Here, we provide an optimized method for tryptic digestion and peptide mapping using adalimumab as an example. Adalimumab is a recombinant human IgG1 mAb glycoprotein of 1330 amino acids specific for human tumor necrosis factor (TNF).
The method uses filter-assisted sample preparation (FASP)3, along with a proprietary buffer solution that minimizes amino acid oxidation and deamidation. The FASP based approach is advantageous as it reduces the multiple rounds of washing needed for detergent or reagent removal. Briefly, proteins are denatured, reduced, and alkylated, before their digestion in a small molecular weight cut-off (MWCO) cartridge.
Denaturation makes the proteins more accessible to enzymatic digestion by unfolding them from their native state. The reduction step, carried out with Tris (2-carboxyethyl) phosphine hydrochloride (TCEP), further exposes the protein by breaking the disulfide bonds linking different segments of the protein. In the alkylation step, iodoacetamide (IAM) reacts with free thiol groups to prevent the reformation of disulfide bonds. A highly specific protease, trypsin, is used to cleave the protein into suitably sized peptides, although a combination of multiple proteases may also be used to generate more complete PTM site information. Following digestion, peptides and glycopeptides are separated and analyzed by RP-LC-MS.M.
To determine the suitability of an instrument for RPLC-MS analysis, a mixture of 14 isotopically labeled peptides is analyzed as a system suitability test prior to each run.
In some cases, it may be of interest to quantify specific mAbs in a sample after digestion. For this purpose, isotopically labelled adalimumab, as well as several other mAbs, are available for use as internal standards in quantitation. The main advantage of using such internal standards is the tracking and accounting of every step of the sample preparation and analysis procedure by the heavy mass label.
2. General Procedure for Filter Assisted Protein Digestion
The sample preparation is performed in a 30 kDa molecular weight cut-off filter cartridge as this simplifies the washing and removal of reagents. The filter membrane retains the mAb of interest until the digestion procedure is complete, following which peptides can pass through the filter while excluding trypsin. The illustration below depicts the sample preparation steps.
2.1 Reagent Preparation
~8 M Urea solution
Dissolve 2.25 g of urea in 3 mL of water. The solution can be warmed slightly to aid in dissolution while mixing, but not above 30 °C. Heating above 30 °C will prompt formation of isocyanate. Always use freshly prepared urea solution to avoid formation of isocyanate and possible carbamylation of proteins.
100 mM TCEP solution
From 0.5 M TCEP solution, prepare 100 mM TCEP by diluting 200 μL into 800 μL of 8 M urea.
100 mM iodoacetamide (IAM)
Dissolve 1 vial in 606 μL 8 M urea for a 500 mM stock. Further dilute to 100 mM working solution by combining 200 μL of 500 mM IAM stock into 800 μL 8 M urea. IAM degrades quickly in solution, so always use freshly prepared solution and discard the unused material.
SOLu-trypsin
This product comes ready for use at 1 mg/mL concentration and can be stored at 2-8 °C up to two years.
Low Artifact Digestion Buffer (LADB)
This product is ready for use and can be stored at 2-8 °C up to two years.MSRT1
A mix of 14 isotope labelled peptides. See product data sheet for system suitability preparation instructions.
2.2 Samples
The adalimumab reference sample (Humira) was obtained from Abbvie, Inc. (North Chicago, IL) and analyzed using the following protocol.
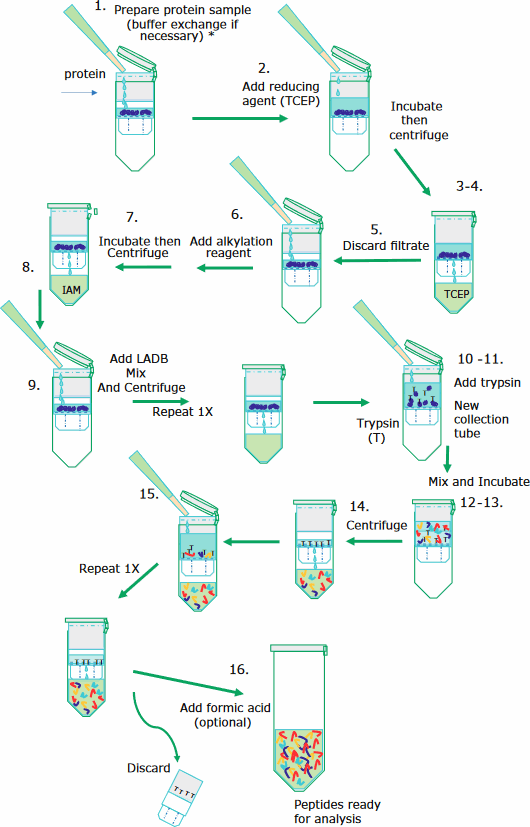
Step by Step: following illustration
mAbs are denatured, reduced, alkylated, and digested as follows:
- Ideally start with 50 μg or more of protein. The sample solution should not exceed 100 μL. Bring the volume to 20 μL with water if less than 20 μL.
Note: Exchange buffer to 8 M urea if sample solution is known to interfere with reduction or alkylation. - Add 100 μL of 100 mM TCEP at a pH of 6.5. Incubate for 30 min at 37 °C while mixing at 300 rpm.
- Transfer the reduced sample to a 30 kDa Microcon® filter in a collection tube.
Note: Do not use Amicon® filter or any type of membrane other than Microcon nitrocellulose 30K cut-off filter. - Centrifuge at 14,000 x g for 5 minutes*.
- Discard the flow-through from the collection tube
- Add 100 μL of 100 mM IAM and vortex for 1 minute. Incubate while mixing for 20 minutes at ambient temperature in the dark.
- Centrifuge at 14,000 x g for 5 minutes.
- Discard flow-through from the collection tube.
- Add 150 μL of LADB and centrifuge at 14,000 x g for 5 minutes*. Repeat this step once more.
- Transfer the filter unit to new collection tube. Add 100 μL of LADB to each filter unit.
- Add enough 1 mg/mL SOLu-Trypsin to have an enzyme to protein ratio of ~1:10 and vortex for 1 minute.
- Wrap the filter unit with parafilm to prevent evaporation.
- Incubate the filter unit at 37 °C for 4 hours while mixing at 300 rpm.
- Centrifuge the filter unit at 14,000 x g for 5 minutes*
- Add 40 μL of LADB Buffer and centrifuge the filter unit at 14,000 x g for 3 minutes*. Repeat this step once more.
*Note: If the solution has not been fully collected, centrifuge for 2 additional minutes. Do not centrifuge for longer time than necessary; longer centrifuge time tends to increase oxidation. - Add 2 μL of neat formic acid to the filtrate, vortex, and centrifuge briefly. (This step is optional since some peptides may precipitate at low pH).
Comments for obtaining higher sequence coverage:
- Vacuum dry down can be used if less than 50 μg protein was available initially. This will provide further concentration of the sample.
- Some large and hydrophobic peptides may not pass through the FASP filter. To prevent losing those peptides and obtain higher sequence coverage after trypsin digestion, take the solution above the filter, and place it in a new collection tube. Centrifuge the filter unit at 14,000 x g for 5 minutes. Add 40 μL of LADB and centrifuge the filter unit again at 14,000 x g for 3 minutes. Repeat this step once more. Combine all solutions (both filtered and unfiltered).
2.4 Instrument Parameters
LC-MS System Parameters
2.5 Data Analysis
The raw MS files were subjected to BioPharma Finder™ 3.0 (Thermo Fisher Scientific) for peptide mapping. Peptide identifications were performed by searching the processed data against the adalimumab sequence. The search parameters used are as follows: Trypsin with medium specificity as a selected protease, carboxymethylation (+58.005 Da) was set as a static modification of Cys residues, oxidation (+15.995 Da) of Met and Trp, deamidations (+0.984 Da) of Asn and Gln, pyroglutaminated Glu (−18.011 Da) of N-terminal Glu, residual C-terminal Lys (+128.095 Da), and common monoclonal antibody glycosylations such as G0, G0F, G1F, G2F set as variable modifications. The data was filtered to report only the peptides with a mass tolerance of ±15 ppm.
3. Results
3.1 System Suitability
For each batch of samples analyzed, it is good practice to evaluate instrument performance through the use of a system suitability test, Figure 1. MSRT1 is an injection ready standard of 14 synthetic peptides that serves to evaluate LC-MS system performance, compare LC gradients and columns, or monitor other system changes. MSRT1 has also been used to predict retention times of peptides across LC-MS platforms.4 Each peptide incorporates a heavy isotope labelled amino acid to eliminate the chance of interfering with peptides occurring in samples. MSRT1 can be used in multiple reaction monitoring (MRM) experiments and a list of suggested transitions is available on the product page at www.sigmaaldrich.com.
Figure 1 shows a chromatogram of MSRT1 and demonstrates the separation obtained for this set of peptides under the chromatographic conditions utilized. Many laboratories will inject a standard such as this to evaluate system performance before, during, and at the completion of a sample set.
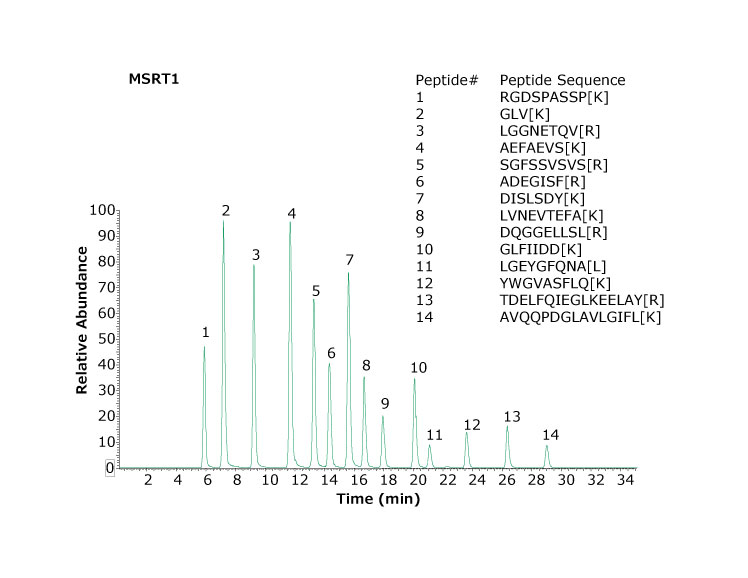
Figure 1.Base peak chromatogram of MSRT1 peptides separated using two Ascentis™ Express Peptide ES-C18 columns (1.0 mm x 150 mm, 2.7 μm particles). Bracketed amino acids in the inset denote isotope labeled amino acids.
3.2 Peptide mapping
Traditional peptide mapping procedures used for LC-MS are often cumbersome and involve overnight protease digestion of the sample at elevated pH and temperature. Asparagine deamidation and methionine oxidation can take place during these steps, the extent of which depends on the conditions, such as reagent used, ionic strength, temperature, pH, incubation time, digestion buffer, and presence of trace metals (in the case of methionine oxidation).5 The method provided here minimizes artifact formation to obtain a more accurate determination of endogenous levels of deamidation and oxidation. In addition, the entire process is simplified with the use of Microcon® MWCO filters.
Figure 2 shows the chromatographic profile obtained using the columns and instrument conditions described including identification of very hydrophilic peptides. Coupling two columns together provides slightly better retention of hydrophilic peptides and is possible due to the lower backpressures obtained with Fused-Core® particles. The glycopeptide eluting at 24.03 min produced the spectrum and results shown in Figure 3.
Figure 4 shows the sequence coverage map obtained for adalimumab, Table 1 summarizes sequence coverage results. The advantage obtained by coupling two 15 cm, Ascentis® Express Peptide ES-C18 columns, end to end, again shows better than 93% coverage for both the heavy and light chains of adalimumab.
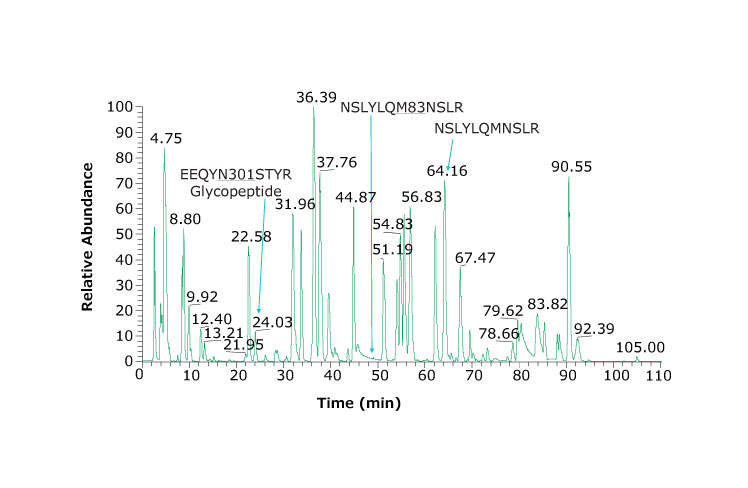
Figure 2.Base peak chromatogram of adalimumab tryptic peptides. Heavy chain glycosylated peptide (EEQYN301STYR) is observed at 24.03 min. Using a dual column set up, we observe hydrophilic peptides such as PGK, SCDK, VDK eluting at 3.95, 2.57, and 2.76 min, respectively. An example peptide and its oxidized form are NSLYLQM83NSLR and NSLYLQMNSLR and eluting at 49.30 and 64.16 min, respectively.
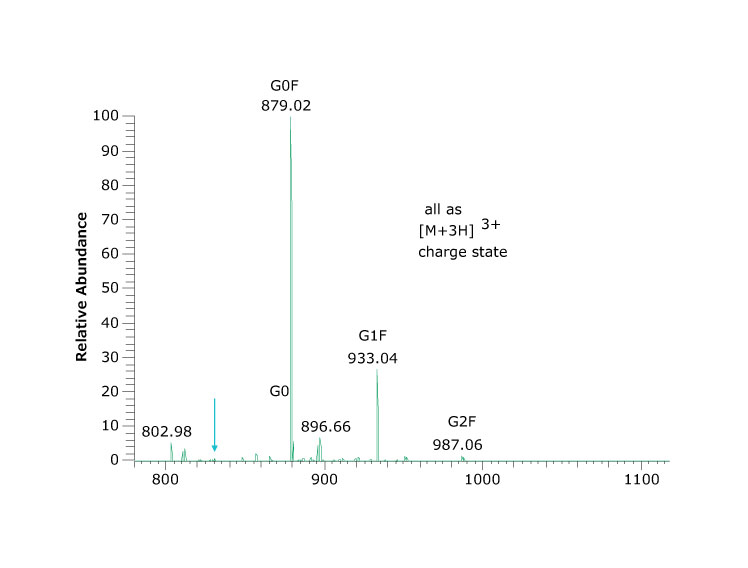
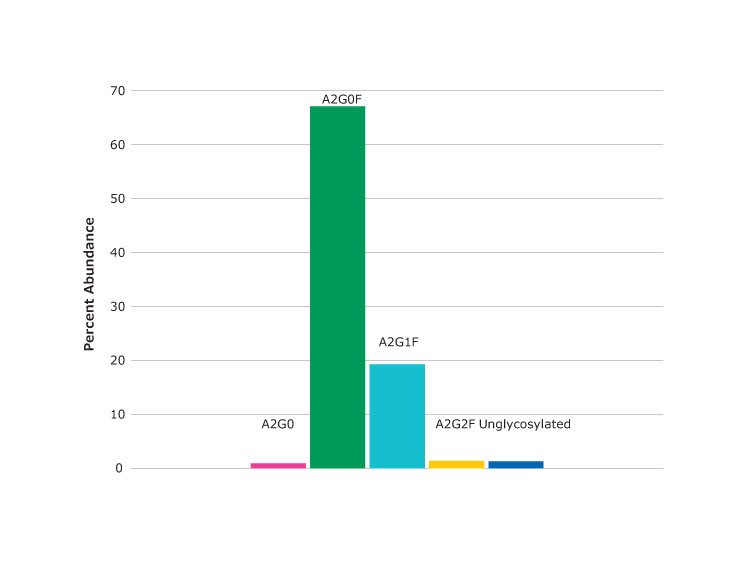
Figure 3.Spectrum (top) and percent abundance (bottom) of glycans found at asparagine N301, the peptide glycoforms shown in Figure 2 as peak at 24.03 minutes.
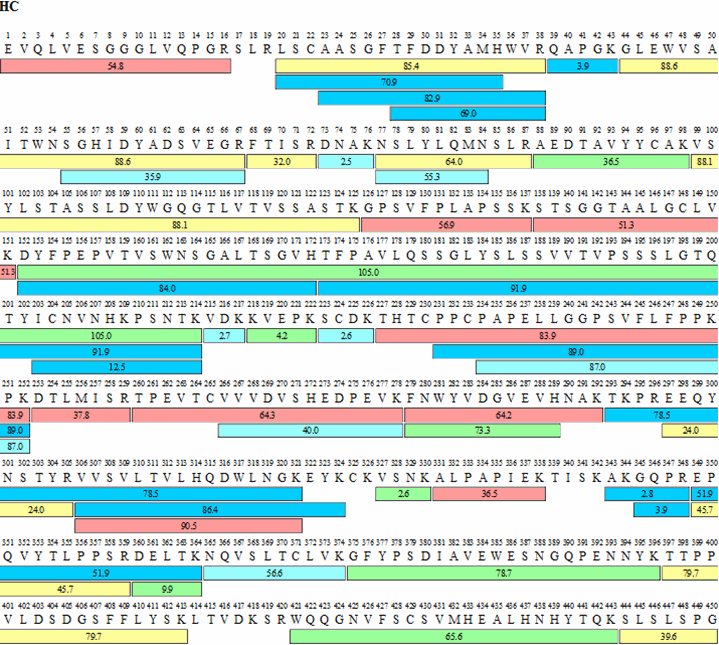
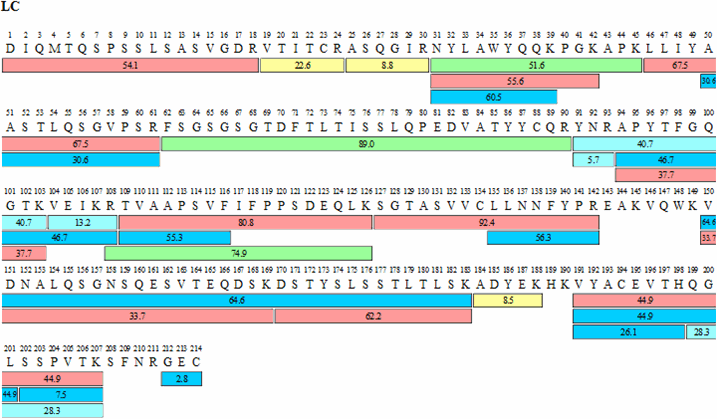
Figure 4.Sequence map for adalimumab heavy (HC) and light chains (LC) obtained by FASP tryptic digestion and chromatographic procedures described. The numbers within each bar indicate retention times for each peptide while the color indicates signal intensity according to scheme shown.
The low artifact digestion buffer and procedure described helps to minimize the oxidation and deamidation that can occur during the sample preparation stage. In this procedure, essentially no deamidation was observed (at less than 1%). Oxidation was found at several methionine locations, as shown in Figure 5, but at less than 5%. Figure 6 shows the peptide containing the M83 oxidation site (labeled). The chromatogram in Figure 6 shows an example of a missed cleavage although these were not found at levels considered significant.
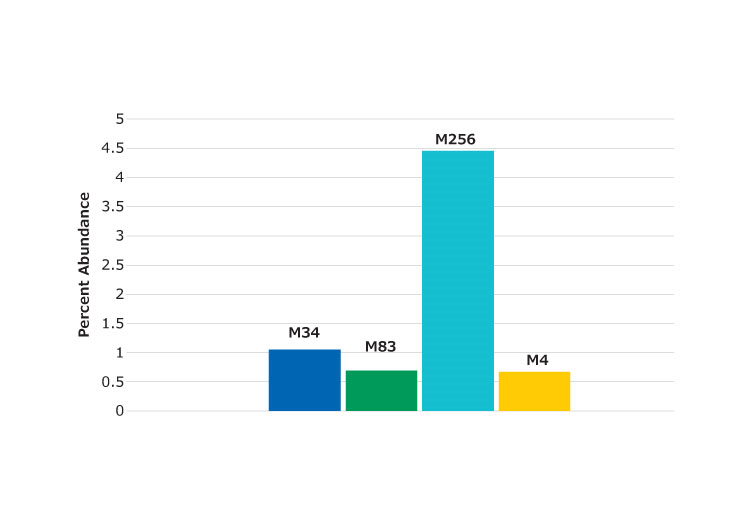
Figure 5.Percent of oxidized peptides found relative to unoxidized form. Labels denote the location of the methionine residue in the protein.
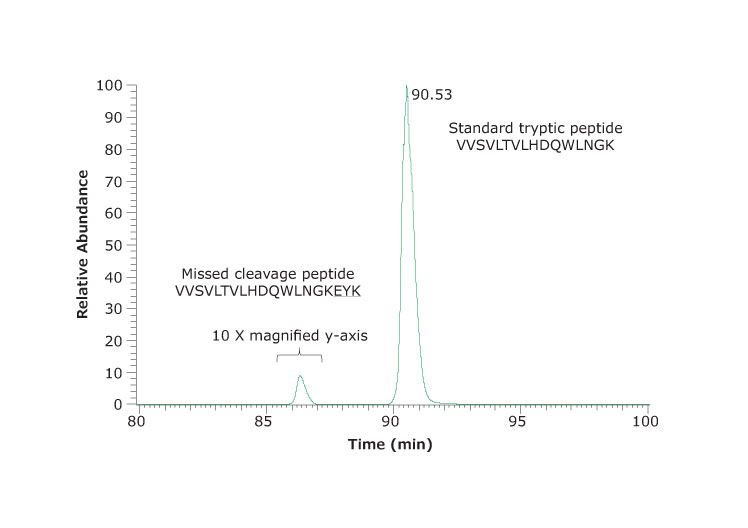
Figure 6.An example of a missed cleavage site. Extracted ion chromatogram of VVSVLTVLHDQWLNGK and the corresponding peptide VVSVLTVLHDQWLNGKEYK with one missed cleavage site. The missed cleavage peptide was 0.6% of the total. One other missed cleavage peptide identified was not significantly abundant.
4. Conclusion
A complete LC-MS/MS workflow has been developed for peptide mapping of monoclonal antibody therapeutics. This workflow offers the following:
- System suitability testing with a synthetic mixture of 14 isotope labeled peptides
- A step-by-step filter assisted sample preparation procedure for denaturation, reduction, alkylation, and digestion of a mAb
- Use of a fast, 4-hour digestion in a low artifact digestion buffer
- High sequence coverage
- Complete list of all reagents, consumables, columns, and related products
The low artifact digestion buffer and procedure used help minimize amino acid deamidation and oxidation to provide a more accurate characterization of protein products and understanding of upstream/downstream processes.
Adalimumab digestion is performed in four hours with greater than 93% sequence coverage. The digestion buffer was developed specifically to minimize deamidation and oxidation during the digestion step without sacrificing the digestion efficiency. The buffer pH is optimized for digestion and contains a proprietary antioxidant.
The determination of several glycoforms during the chromatographic run also demonstrates the multi-attribute aspect of peptide mapping.
The protease, SOLu-Trypsin, is a proprietary liquid formulation of recombinant trypsin (porcine sequence expressed in Pichia pastori), stable in solution form when refrigerated. The FASP digestion protocol simplifies the task of buffer exchange, washing, and sample preparation.
Related Products
References
To continue reading please sign in or create an account.
Don't Have An Account?