跳转至内容
Merck
CN
HomeSmall Molecules Analysis & QCAssay of Betamethasone Sodium Phosphate by HPTLC

Assay and Identification of Betamethasone Sodium Phosphate by HPTLC

Dr. Ajay Kaparwan, Application Scientist, R&D

Abstract

This article introduces a highly efficient thin-layer chromatography (HPTLC) method for accurately measuring and identifying betamethasone, a glucocorticoid commonly used in different therapeutic applications. The method utilizes a Silica Gel 60 F254 HPTLC plate and involves two detection approaches, UV light at 254 nm and derivatization with 2,4-dihydroxybenzaldehyde. The method exhibits linearity across a concentration range of 1 to 7 µg/spot. The detection limit (LOD) and quantification limit (LOQ) were established as 0.91 µg/spot and 2.74 µg/spot, respectively. The method was validated with an assay range of 96.0 to 103%, confirming its suitability for quality control of betamethasone in pharmaceutical applications.

Section Overview
Introduction

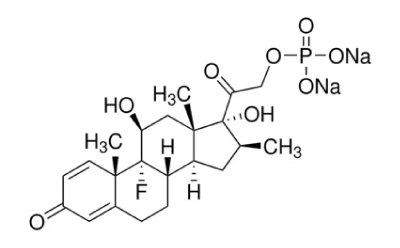
Chemical structure of Betamethasone sodium phosphate

Betamethasone sodium phosphate

Betamethasone Sodium Phosphate is the disodium salt of the 21-phosphate ester of betamethasone, a synthetic glucocorticoid with metabolic, immunosuppressive and anti-inflammatory actions.1

The European Pharmacopoeia monograph for betamethasone sodium phosphate employs high-performance thin layer chromatography (HPTLC) technique for the identification and spectrophotometric method for assay.2,3

Here we show a method for identification and assay of betamethasone sodium phosphate using 2 detection approaches and a densitometric measurement.
Experimental

Table 1.HPTLC conditions for identification and assay of betamethasone sodium phosphate

Results

Identification

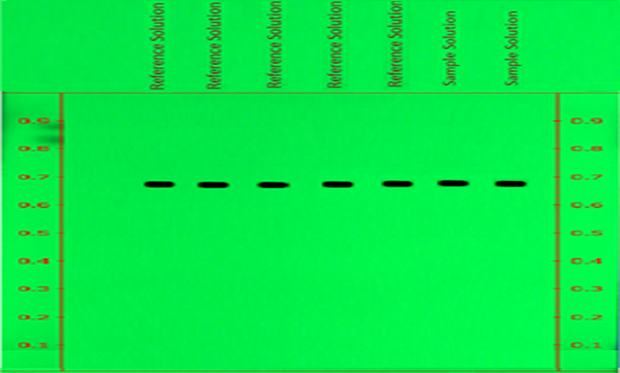
A thin-layer chromatography (TLC) plate, visualized under UV light at 254 nm, displays a vibrant green background. Both edges of the plate have 9 red markings from 0.1 to 0.9 cm at 0.1 cm intervals. A line is drawn across the top at the 1 cm mark, with tracks labeled above it. The plate shows seven distinct spots: five labeled as reference solution (from left to right) and the last two on the right labeled as sample solution. These spots are positioned just below the Rf value of 0.7 and stand out clearly against the green background.

Figure 1.Determination of Repeatability of betamethasone spots for reference solution and sample on chromatogram measured at wavelength 254nm (Detection A).
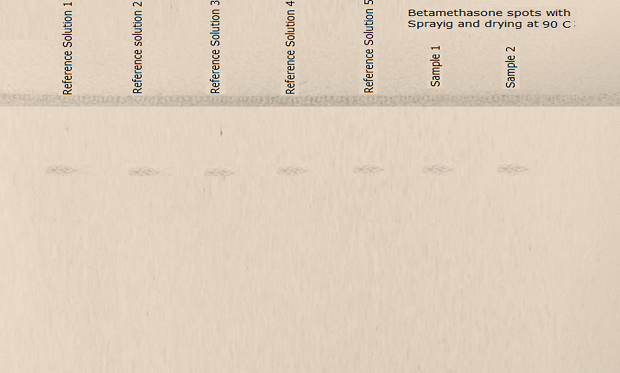
A thin-layer chromatography (TLC) plate, visualized under daylight after spraying with test solution, followed by drying at 90˚C, in buff color. A line is drawn at the top, with tracks labeled above it. The plate shows faintly colored seven distinct spots at same position: five labeled as reference solution 1, 2, 3, 4, and 5 respectively (from left to right) and the last two on the right labeled as sample solution 1 and 2.

Figure 2.The principal spot of reference and sample in the chromatogram obtained with the test solution in day light after derivatization (Detection B).

According to Ph. Eur. 11.0, the principal spot in the chromatogram obtained with the test solution should be similar in position, color, and size to the principal spot in the chromatogram obtained with the reference solution. (Figure 2).

Reproducibility
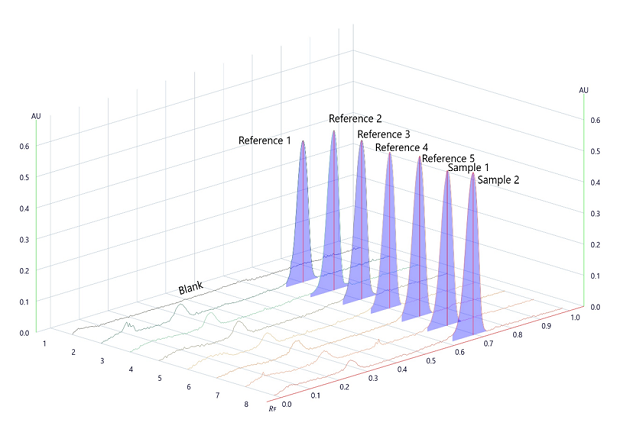
A 3-dimensional TLC-densitogram, obtained for the developed plate using a TLC analyzer and scanned at 254 nm. The x-axis on the flat rectangular surface shows the position of the tracks, ranging from 0 to 7, indicating where each compound starts on the plate. The y-axis displays the retention factor, ranging from 0.0 to 1.0 at intervals of 0.1. The z-axis represents the detector's response in absorbance units (AU), ranging from 0.0 to 0.5 at intervals of 0.1. Seven peaks rise from the flat rectangular surface, corresponding to the seven tracks spotted on the plate, labeled 1 to 7 from left to right. There are five peaks labeled as Reference 1 to 5 (from left to right) and the last two on the right labeled as sample 1 and 2.

Figure 3.Densitogram for Repeatability and Area under the peak measured at wavelength 254nm.

Table 2.System suitability and repeatability betamethasone reference solution repeatability (5 μg per spot) measured at 254 nm
Table 3.System suitability test results observed.

Assay for Betamethasone Sodium Phosphate by HPTLC

Linearity LOD and LOQ

Linearity of betamethasone sodium phosphate peak area measurements by densitometry at 254 nm for a calibration range of 1 to 7 µg/spot.
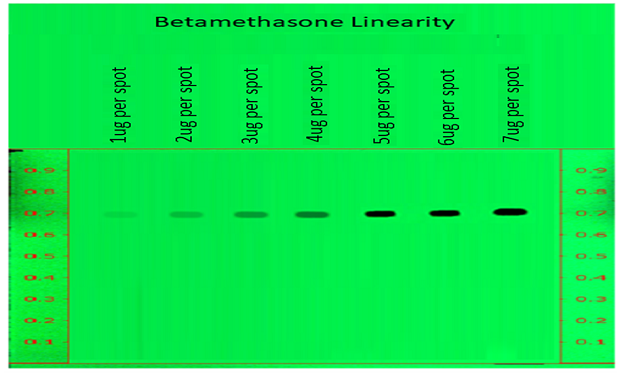
A thin-layer chromatography (TLC) plate, visualized under UV light at 254 nm, displays a vibrant green background. Both edges of the plate have 9 red markings from 0.1 to 0.9 cm at 0.1 cm intervals. A line is drawn across the top at the 1 cm mark, with tracks labeled above it. The plate shows seven distinct spots, with the spots becoming more intense from left to right, confirming the increase in the concentration of betamethasone. The seven labeled as 1 µg, 2 µg, 3 µg, 4 µg, 5 µg, 6 µg, and 7 µg (from left to right. These spots are positioned same, just below the Rf value of 0.7 and stand out clearly against the florescent green background.

Figure 4.Determination of Linearity of betamethasone sodium phosphate measured at wavelength 254nm.
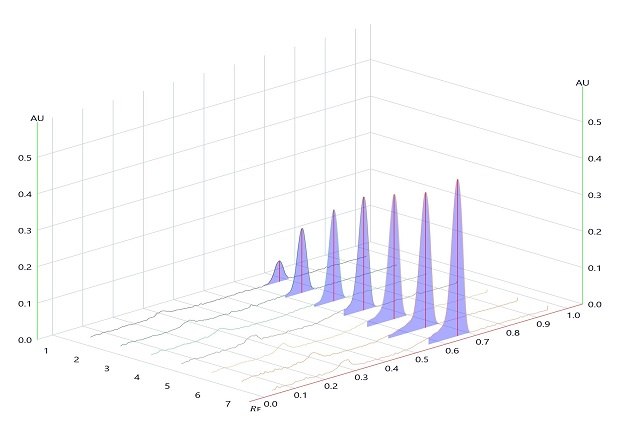
A 3-dimensional TLC-densitogram, obtained for the developed plate using a TLC analyzer and scanned at 254 nm. The x-axis on the flat rectangular surface shows the position of the tracks, ranging from 0 to 7, indicating where each compound starts on the plate. The y-axis displays the retention factor, ranging from 0.0 to 1.0 at intervals of 0.1. The z-axis represents the detector's response in absorbance units (AU), ranging from 0.0 to 0.5 at intervals of 0.1. Seven peaks rise from the flat rectangular surface, corresponding to the seven tracks spotted on the plate, labeled 1 to 7 from left to right. The peaks increase in height from track 1 to 7, indicating an increase in the concentration of betamethasone. All peaks are obtained at the same position just below the Rf value of 0.7.

Figure 5.Densitogram for Linearity of betamethasone sodium phosphate measured at wavelength 254 nm.
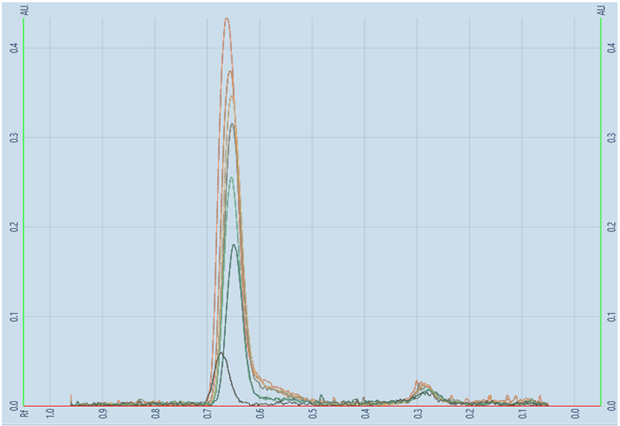
A TLC-densitogram, obtained for the developed plate using a TLC analyzer and scanned at 254 nm. The y-axis represents the detector response in absorbance units (AU) with major tick marks at 0.1, 0.2, 0.3, 0.4. The x-axis displays the retention factor, with major tick marks at intervals of 0.1, ranging from 0.0 to 1.0 (from right to left). It shows an overlay of peaks formed between Rf values of 0.7 and 0.6, of increasing heights obtained for the seven individual tracks.

Figure 6.Linearity scan of betamethasone sodium phosphate.
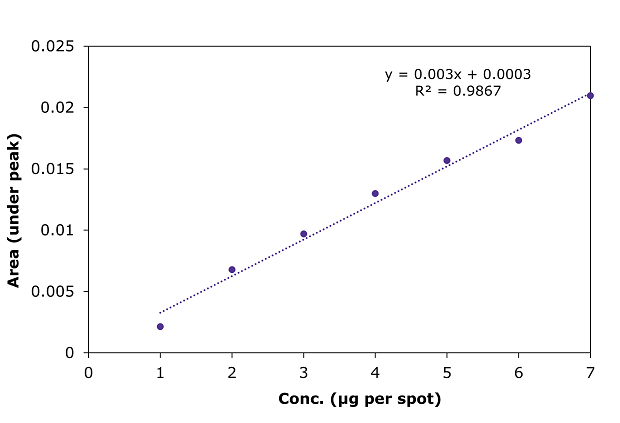
Table 4.Calibration data for betamethasone sodium phosphate measured at 254 nm
A calibration curve plot for betamathasone, scanned at 254 nm, shows Peak Area versus concentration (µg/spot). The x-axis has seven major ticks from 1 to 7 µg at intervals of 1 µg, representing concentration in µg. The y-axis, showing peak area, has five major ticks from 0.005 to 0.025 at intervals of 0.005. Seven data points are obtained in the range of 1 to 7 µ, with a blue colored straight dotted line passing closer to all the seven points (blue dots) as the best fit line. The line of best fit is represented by the equation ‘y = 0.003x + 0.0003,’ with a coefficient of determination (R²) of 0.9867.

Figure 7.Calibration curve for betamethasone sodium phosphate by HPTLC at 254 nm.

Accuracy and Recovery
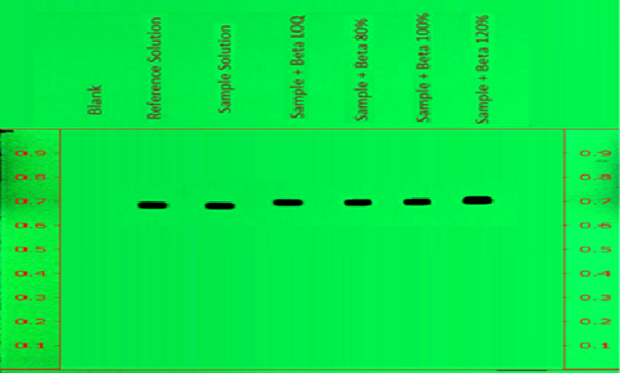
A thin-layer chromatography (TLC) plate, visualized under UV light at 254 nm, displays a vibrant green background. Both edges of the plate have 9 red markings from 0.1 to 0.9 cm at 0.1 cm intervals. A line is drawn across the top at the 1 cm mark, with tracks labeled above it. The plate shows six distinct spots, with intense spots appearing from tracks numbered 2 to 6 from left to right against the florescent green background. The first track is labeled “Blank” and doesn’t show any spot, the remaining tracks are labeled as Reference Solution, Sample solution, Sample + Beta LOQ, Sample + 80% Beta Spike," the sixth peak is labeled "Sample + 100% Beta Spike," and the seventh peak is labeled "Sample + Beta 120% Spike’’.

Figure 8.Determination of accuracy of betamethasone sodium phosphate with spiking over sample on chromatogram at measured wavelength 254nm.
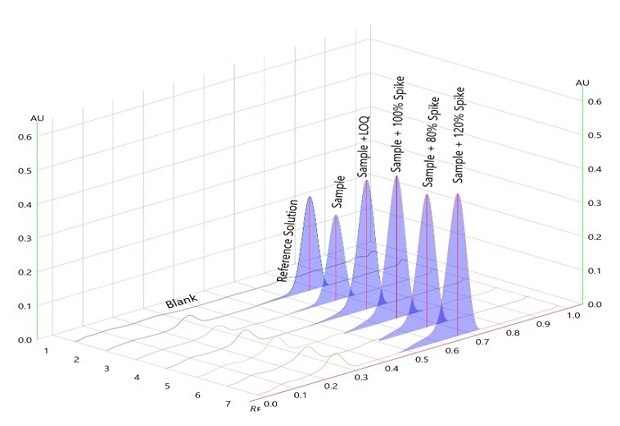
A 3-dimensional TLC-densitogram, obtained for the developed plate using a TLC analyzer and scanned at 254 nm. The x-axis on the flat rectangular surface shows the position of the tracks, ranging from 0 to 7, indicating where each compound starts on the plate. The y-axis displays the retention factor, ranging from 0.0 to 1.0 at intervals of 0.1. The z-axis represents the detector's response in absorbance units (AU), ranging from 0.0 to 0.6 at intervals of 0.1. Six peaks rise from the flat rectangular surface, corresponding to tracks 2 to 7, spotted on the plate from left to right. Track one, labeled "Blank," doesn’t show any peak. The second peak is labeled "Reference Solution," the third peak is labeled "Sample." The fourth peak is labeled "Sample + LOQ," the fifth peak is labeled "Sample + 80% Spike," the sixth peak is labeled "Sample + 100% Spike," and the seventh peak is labeled "Sample + 120% Spike’’.

Figure 9.Densitogram for accuracy of betamethasone sodium phosphate with spiking over sample on plate/chromatogram measured at wavelength 254nm.

Table 5.Accuracy and recovery determination for betamethasone sodium phosphate spiked samples

Conclusion

The presented instrumental HPTLC method is simple, linear, and selective over a concentration range from 1 to 7 µg/spot. The RSD for repeatability of area under the curve and retardation factor is < 2%. The limit of detection (LOD) was 0.91 µg/spot, and the Limit of Quantification (LOQ) was 2.74 µg/spot. The percentage recovery of betamethasone ranged from 96.5 to 104.4%.

Related Products
Loading

References

1.
Betamethasone Sodium Phosphate. Nih.gov. . [Internet]. PubChem.[updated 10 Jul 2024]. Available from: https://pubchem.ncbi.nlm.nih.gov/compound/Betamethasone-Sodium-Phosphate
2.
Betamethasone Sodium Phosphate. Monograph 01/2008:0810. 10.0, 1970 (expired). [Internet]. Eur. Pharmacopeia. Available from: https://www.edqm.eu/en/-/shutdown-of-european-pharmacopoeia-10th-edition
3.
Betamethasone Sodium Phosphate Monograph 07/2021:0810. 11.0, 2089. [Internet]. Eur. Pharmacopeia. Available from: https://pheur.edqm.eu/
登录以继续。

如要继续阅读,请登录或创建帐户。

暂无帐户?