Determination of 2-Chloroethanol as Marker for Fumigant Ethylene Oxide in Sesame Seeds by HS-SPME-GC-MS

Abstract
The main goal of this work was to develop and optimize an HS-SPME-GC-MS sampling method to measure 2-chloroethanol as a marker of ethylene oxide in sesame seed samples. The developed method was then applied to quantify the marker in a variety of sesame seeds of different origins. It was found that 2-chloroethanol was present in two of the samples with concentrations in the range of 84-151 ng/g, values above the permitted concentration levels established by the Europe Union regulation (EC) No 396/2005 in oil seeds.
Introduction
Ethylene oxide (EO) gas is used as a fumigant for the control of insects and microorganisms in food commodities.1 It reacts with natural chlorides present in the food matrix to form 2-chloroethanol, a known carcinogen, that may persist in the food product for long periods of time, even throughout food processing.2,3 Due to the demonstrated harmful health effects of these compounds, the employment of EO as a fumigant for food commodities is being progressively regulated or banned in several countries.4 Currently, Europe controls the use of this fumigant in food by regulation (EC) 396/2005, which defines its concentration as a sum of EO and 2-chloroethanol, with a permissible concentration of 0.05 mg/kg in nuts, oil fruits, and oil seeds.5 The aim of this study was to develop a high- throughput HS-SPME-GC-MS method to detect and quantify 2-chloroethanol as a marker for EO fumigation in sesame seeds.
Four commercially available SPME fibers were used to determine the selectivity of the SPME fiber coating for the headspace extraction of sesame seeds followed by GC-MS analysis. Carboxen-PDMS coating on a nitinol core was more effective in the extraction and desorption of 2-chloroethanol, and the optimized HS-SPME-GC-MS method demonstrated overall good linearity, reproducibility, and sensitivity. This shows that the method exhibits great potential as a quality control methodology for the fast screening of 2-chloroethanol. Additionally, this method was successfully applied for analyzing 2-chloroethanol in 3 sesame samples of different origins.


Figure 1. Structure of ethylene oxide and its marker 2-chloroethanol.
Experimental Conditions
The HS-SPME method optimization was achieved using sesame seed samples obtained from a local market with an undetectable GC-MS level of 2-chloroethanol. During the method development, fiber selectivity, extraction time (1, 2, 5, 10, 15, 20 min), and temperature (30, 40, 50, and 60 °C) parameters were studied. For this purpose, 1 g of 2-chloroethanol-free sesame seeds were spiked with 1 µL of a 20 ng/g solution of 2-chloroethanol prepared in methanol. The HS-SPME-GC-MS method is summarized in Table 1 and Table 2.
Results and Discussion
HS-SPME Method Optimization Procedure
Coating Selectivity
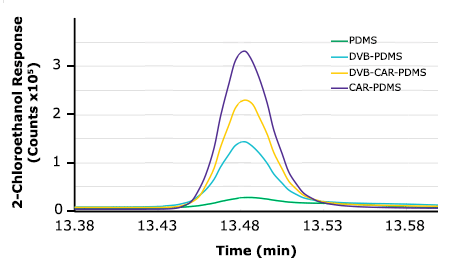
Initial tests were conducted using 4 different fibers including PDMS, DVB/PDMS, CAR/PDMS, and DVB/CAR/ PDMS to evaluate the performance and effectiveness of each fiber coating material for the headspace extraction of 2-chloroethanol in sesame seed samples. The extraction conditions were as follows: equilibrium time of 2 min, extraction time of 10 min, and extraction temperature of 40 °C. Further sample preparation conditions are mentioned in the experimental section. Additionally, a 3-min desorption time was adopted since preliminary tests proved that it allowed a complete desorption of analytes from the fiber. The results of comparing different fibers are shown in Figure 2, which depicts 2-chloroethanol chromatogram peak response. CAR/PDMS fiber renders the highest peak response, which indicates that this fiber is the most efficient chemistry for the extraction of 2-chloroethanol in terms of sensitivity and selectivity. The presence of micropores in the coating structure of the CAR/PDMS fiber allows the retention and release of small analytes (i.e., 2-chloroethanol) more efficiently. Thus, CAR/PDMS was used for further HS-SPME method optimization.

Figure 2.Evaluation of four SPME coating chemistries on the extraction of 2-chloroethanol in sesame seeds.
Effect of Extraction Temperature and Extraction Time
The SPME extraction time profile was obtained by repeated measures (n=3) of matrix-matched standard samples at increasing extraction time (up to 20 min), following the sample preparation described previously. The results plotted in Figure 3 pointed out a change in the sorption dynamic after 10 minutes of fiber extraction, as evidenced by the decrease in the curve slope. The extraction temperature of 40 °C allowed the highest analytical response. Additionally, the minimum equilibrium time was found to be 2 min (data not shown).

Figure 3.Time and temperature extraction profiles for 2-chloroethanol obtained via HS-SPME-GC-MS with CAR-PDMS. Mean values and standard deviation of 2-chloroethanol peak area (n=3). Sample: 1 g sesame seeds spiked with 20 ng/g of 2-chloroethanol.
Method Validation
The method was validated in terms of linearity, limits of detection (LOD), limits of quantification (LOQ), accuracy, and repeatability. The results of the study are summarized in Table 3. Linearity was assessed through the construction of a multipoint calibration curve, at seven different concentration levels from 5 ng/g-150 ng/g. The calibration curve range was selected based on the permitted concentration level established by the European regulation (50 ng/g) for ethylene oxide and 2-chloroethanol in nuts, oil fruits, and oil seeds.5 The calibration curve was prepared by adding proper volumes of 2-chloroethanol standard into SPME vials containing 1.0 g of 2-chloroethanol-free sesame seeds. Figure 4 shows the calibration curve obtained in which good linearity across the calibration range was obtained with a correlation coefficient value (R2) of 0.9997.
Excellent accuracy of 99% was obtained over the analytical range with method repeatability of 1% RSD. This was achieved by analyzing 7 replicates of SPME extractions of sesame seed samples spiked at 5 ng/g. For the calculation of LODs and LOQs, seven spiked samples (5 ng/g) were tested. LOD and LOQ were determined by calculating the uncertainty of the calibration curve in the range of the LOQ.6 LOQ was measured as 10 times the standard deviation used for LOD. LOD of 2.0 ng/g and LOQ of 6.8 ng/g for 2-chloroethanol were achieved using the CAR/PDMS chemistry.

Figure 4.Calibration Curve of Absolute Responses of 2-chloroethanol. Triplicates were carried out for each point of the curve.
Quantification of 2-Chloroethanol in Real Sesame Seed Samples
White raw, roasted white, and black sesame seeds from different origins were acquired from local markets and analyzed as per the given HS-SPME method. 2-Chloroethanol concentrations in the tested samples are reported in Table 4. 2-Chloroethanol was not detected in white raw sesame seed samples. However, it was detected in roasted black and white sesame seeds samples with concentrations of 84 and 151 ng/g, respectively. These concentrations are above the permissible values established by European regulation (50 ng/g) in sesame seeds. A possible source of contamination during the processing of sesame seed samples with ethylene oxide or 2-chloroethanol can occur when combustible gases containing ethylene oxide contaminate the sample during the drying or roasting processes.6 Thus, the roasting process could be the source of contamination of the analyzed samples in which high content of 2-chloroethanol was observed.
Conclusions
This study developed and optimized an HS-SPME- GC-MS method using a Carboxen®-PDMS fiber on a nitinol core for the analysis of 2-chloroethanol as a marker of ethylene oxide in sesame seeds. The SPME method yielded good sensitivity, accuracy, and reproducibility when applied to the analysis of sesame seed samples. The Carboxen®-PDMS chemistry allows the efficient retention and release of small analytes such 2-chloroethanol due to the presence of micropores such 2-chloroethanol due to the presence of micropores in the fiber structure.
This study demonstrated that HS-SPME-GC-MS employing a CAR/PDMS fiber can be used as a quality control methodology for fast screening of 2-chloroethanol as a marker of ethylene oxide in food commodities.
Products
References
如要继续阅读,请登录或创建帐户。
暂无帐户?