Improving the Chromatographic Separation of DMB-Labeled Sialic Acids for the Comparison of Biosimilars to Reference Materials
Read more about
Abstract
Sialic acids are N- or O-substituted derivatives of neuraminic acid. They are important because they affect bioavailability, function, stability, and metabolism of glycoproteins. Two forms of sialic acid are commonly present in therapeutic glycoproteins: N-acetylneuraminic acid (NANA) and N-glycolylneuraminic acid (NGNA). One of the most common quantification methods involves releasing the sialic acids from the glycoprotein, derivatizing NANA and NGNA with 1,2-diamino-4, 5-methylenedioxybenzene dihydrochloride (DMB), followed by analysis by Reversed-Phase HPLC with fluorescence detection. This procedure is subject to interference from peaks originating from excess reagent and other derivatized impurities, limiting sensitivity and reproducibility. The objectives of this study were to develop a significantly improved HPLC-fluorescence method for DMB-NANA and DMB-NGNA, and to apply this method to compare two candidate biosimilar therapeutic proteins to their respective reference materials.
Experimental
LC optimization was performed using standard mixtures of DMB-NANA and DMB-NGNA using HPLC with fluorescence detection. Four column types of the same dimensions were evaluated: C18, F5, RP-Amide (all reversed-phase columns), and bare silica (HILIC column). Flow rate and column temperature were held constant at 0.2 mL/min and 30 °C, respectively. Mobile phase composition varied, but A and B solvents were always 0.1% formic acid in water and 0.1% formic acid in acetonitrile, respectively.
Sialic acids were released from glycoproteins, derivatized with DMB (Figure 1), and then analyzed at the optimal chromatographic conditions with fluorescence detection using excitation and emission wavelengths of 373 nm and 448 nm, respectively. Data were fit to external calibration curves. Results were expressed as the ratio of (moles of sialic acid) per (moles of protein).
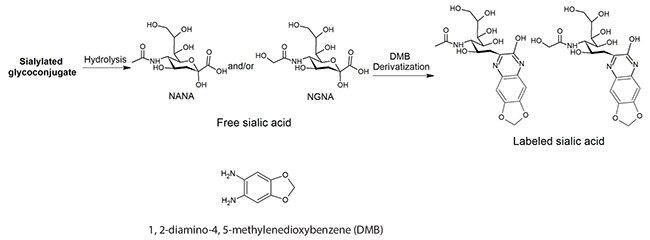
Figure 1. Derivatization of Sialic Acids with 1,2-Diamino-4,5-methylenedioxybenzene (DMB).
Results and Discussion
Figure 2 shows a representative chromatogram of the HPLC separation of the two common sialic acids, DMB-NANA and DMB-NGNA, on a C18 reversed-phase column. The two sialic acids are not completely baseline resolved, while the separation also suffers from a relatively long (25 min) run time and a ternary mobile phase composition. Furthermore, a later study showed that the sialic acids tend to co-elute with several derivatized interferences.
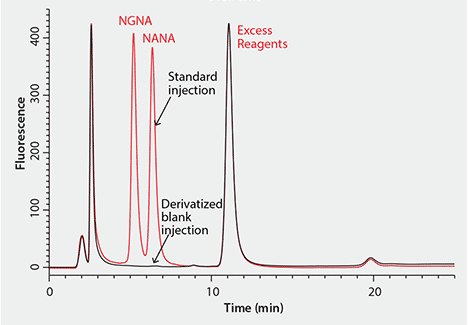
Figure 2. Representative Chromatogram of HPLC Separation of DMB-Labeled Sialic Acids with an Ascentis® C18 Column CONDITIONS: column: Ascentis C18, 15 cm × 2.1 mm I.D., 3 µm (Product No. 581302-U); mobile phase: water:acetonitrile:methanol (84:9:7); gradient: isocratic, 25 minute run time.
We screened several column chemistries (Table 1) in an attempt to develop an alternative method that would provide a shorter analysis time, better overall selectivity and a simpler binary mobile phase composition.
The column screening results in Figure 3 show that the RP-Amide column provides better selectivity for detecting the DMB-labeled sialic acids from the interferences. Therefore this column was chosen for further method development and optimization.
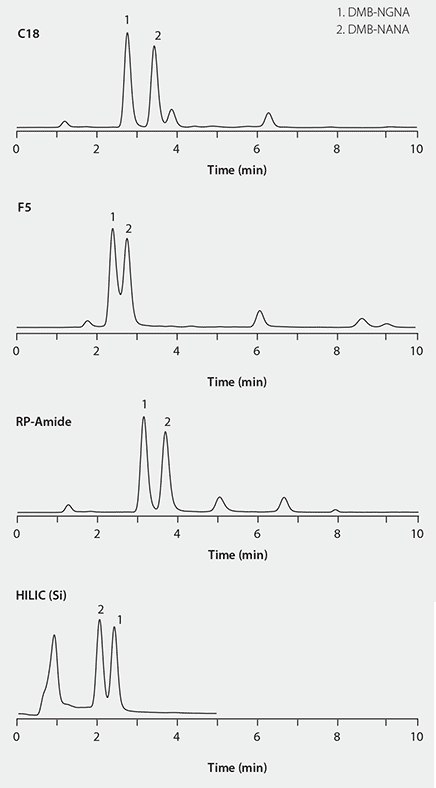
Figure 3. HPLC separations of DMB-labeled sialic acid on different columns.
As can be seen in Figure 4, further optimization of the separation with the Ascentis Express RP-Amide column enabled baseline resolution of the two sialic acids, DMB-NGNA and DMB-NANA, with a 15-minute run time using a simple mobile phase composition (water and acetonitrile, each containing 0.1% formic acid). Importantly, the interferences are well resolved from the sialic acid analytes.
Besides the advantages of a shorter run time, better selectivity, and a simpler mobile phase composition, the newly developed method on the Ascentis Express RP-Amide column also provides a lower limit of quantification and a wider linear range than the original Ascentis C18 method (Table 2.)
![Optimized HPLC Separation of DMB-Labeled Sialic Acids with the RP-Amide Column CONDITIONS: column: Ascentis Express RP-Amide, 10 cm × 2.1 mm I.D., 2.7 µm (<a href="/product/supelco/53913U">53913-U</a>); mobile phase: [A] water; [B] acetonitrile, both with 0.1% formic acid; gradient: 0-1 min 6% B; 1.01-4 min 20%B; 4.01-12 min 6% B, total run time 15 min. Chromatogram showing optimized HPLC separation of DMB-labeled sialic acids with the RP-Amide Column. Two prominent peaks are labeled NGNA and NANA, indicating the presence of these sialic acids. There are also smaller peaks labeled as ‘Interferences’ and one at the beginning marked ‘Interference’. The x-axis is labeled ‘Time (min)’ ranging from 0 to 14 minutes, and the y-axis represents the detector response without specified units.](/deepweb/assets/sigmaaldrich/marketing/global/images/technical-documents/articles/analytical-chemistry/small-molecule-hplc/optimized-hplc/optimized-hplc.jpg)
Figure 4. Optimized HPLC Separation of DMB-Labeled Sialic Acids with the RP-Amide Column CONDITIONS: column: Ascentis Express RP-Amide, 10 cm × 2.1 mm I.D., 2.7 µm (53913-U); mobile phase: [A] water; [B] acetonitrile, both with 0.1% formic acid; gradient: 0-1 min 6% B; 1.01-4 min 20%B; 4.01-12 min 6% B, total run time 15 min.
The newly developed RP-Amide method was validated by determining the sialic acid content in erythropoietin (EPO), a glycoprotein. Figure 5 shows the successful detection of NANA at different quantities (2.5, 5.0 and 10 µg) of EPO with minimal interference. The determined molar amounts of NANA per mole EPO are consistent between the three levels of EPO, all passing the specification (>10 mol NANA/mol EPO).
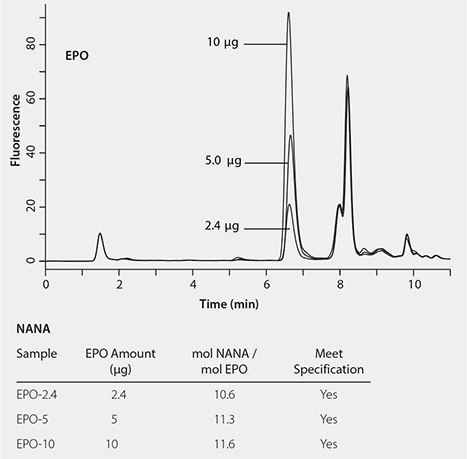
Figure 5. Determination of the sialic acids of EPO.
The RP-Amide method has been successfully applied to determine and compare sialic acid levels in biosimilar candidates to their authentic references. Figure 6 shows that the NANA level in TNFr-FC (Enbrel®) is about 30% lower than in the biosimilar candidate compared to its authentic reference. While Figure 7 shows that the NGNA content in the Erbitux® biosimilar candidate is almost twice that of its authentic reference.
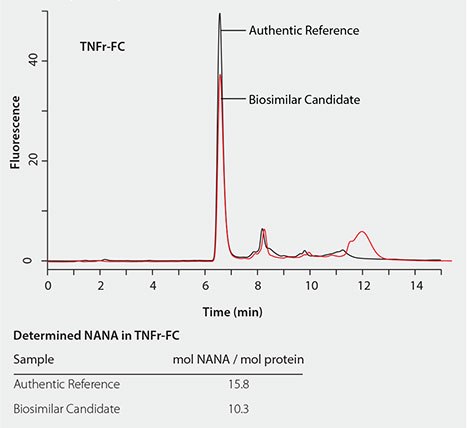
Figure 6. Quantitative comparison of the NANA content in TNFr-FC (Enbrel®) biosimilar candidate to its authentic reference.
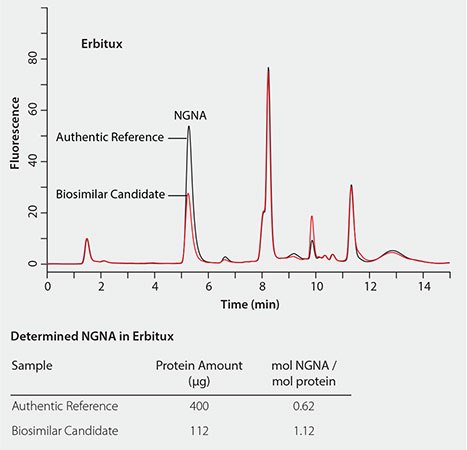
Figure 7. Quantitative comparison of NGNA content in erbitux biosimilar candidate to its authentic reference.
Conclusions
A new HPLC method employing an Ascentis Express RP-Amide column has been developed to determine DMB-labeled NGNA and NANA sialic acids released from biotherapeutic proteins. Compared to the original method using a C18 column, the new method offers the following advantages:
- Simpler mobile phase: water and acetonitrile containing 0.1% formic acid
- Better resolution for DMB-NGNA and DMB-NANA sialic acids
- Shorter run time
- Improved peak shapes
- Wider linear range for quantification
- Lower limit of quantification
Trademarks
Ascentis is a registered trademark of Sigma-Aldrich Co. LLC
Enbrel is a registered trademark of Immunex Corp.
Erbutix is a registered trademark of ImClone LLC
To continue reading please sign in or create an account.
Don't Have An Account?