Plant-Based PCR Inhibitors & Master Mix Performance
The Polymerase Chain Reaction (PCR) has become one of the most widely used techniques in molecular biology. The universal adoption of PCR across a diverse range of applications is due to its apparent simplicity and relatively low cost, making PCR a powerful technology in the lab toolbox. PCR is used to amplify specific target DNA fragments from low quantities of source nucleic acid. Although the reagent components of the PCR contribute to its success or failure, upstream factors that are often not directly considered can also affect success. Endogenous inhibitors found within the sample need to be considered when investigating reaction failure (Table 1).
- Evaluating the effects of PCR inhibitors and PCR enzyme selection using plant genomic DNA
- Plant DNA extraction, purification, and quantification
- Quantification of total phenol in real samples
- Suspected polyphenol inhibition of PCR enzymes
- DNA polymerase PCR master mix comparison
- The effects of PCR inhibitors and PCR enzyme selection on gDNA extraction and qPCR amplification
- Try GenElute™-E Single Spin Purification, request a sample
Evaluating the effects of PCR inhibitors and PCR enzyme selection using plant genomic DNA
The selection of a DNA polymerase can profoundly affect the outcome of the PCR. For most routine PCR, Taq DNA Polymerase has long been the standard PCR enzyme. However, Taq DNA Polymerase has limitations, such as poor amplification of long templates, higher error rates than high-fidelity polymerases, poor amplification of GC-rich templates, and sensitivity to inhibitors. To further evaluate these factors, different genomic DNA extraction methods from plant tissue were compared, suspected PCR inhibitors were investigated, and standard Taq DNA polymerase alternatives in the form of high-fidelity polymerase master mix solutions were assessed for plant-based target amplification.
Endogenous PCR inhibitor examples
Plant DNA extraction, purification, and quantification
The most significant contributor to alternations in UV spectrophotometric readings is phenol contamination. The maximum absorbance of phenol is 270 nm and subsequently close to the 260 nm used for nucleic acid quantification. This narrow range may result in the dramatic overestimation of RNA/DNA concentration. Furthermore, this can lead to over dilution of a sample before PCR and the lack of enough template in the downstream PCR. In comparison, chaotropic salts, often used to bind a sample to a membrane or bead during nucleic acid purifications, are unlikely to greatly impact the 260/280 nm ratio. However, carry-over of chaotropic salts into PCR can lead to inhibition 1.
GenElute™-E Single Spin Plant DNA Kit Protocol
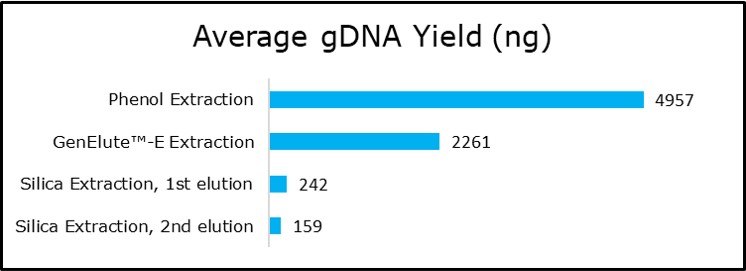
To better understand the performance of different nucleic acid purification methods in total yield and phenol contamination, DNA extraction was performed from 30mg of Ocimum basilicum leaf in triplicate utilizing GenElute™-E Single Spin Plant Extraction Kit, phenol/chloroform extraction with ethanol precipitation: Cetyltrimethylammonium bromide (CTAB) method, and a silica isolation method (Figure 1).
Quantification of Ocimum basilicum (sweet basil) gDNA extracted using various methods

Figure 1.The average yield from triplicate reactions using the GenElute™-E Single Spin Plant Extraction Kit, phenol/chloroform extraction with ethanol precipitation: cetyltrimethylammonium bromide (CTAB) method, and a silica column isolation method, with the recommended repeat elution separated after the extraction step.
Quantification of total phenol in real samples
Polyphenols include flavanol, gallic acid, resveratrol, and secoisolariciresinol. These compounds are major components in medicinal plants, woody plants, and mature plant parts 2. For the assessment of polyphenols, gallic acid was used for total phenol quantitation. Concentrations were estimated based on a plate assay using Folin & Ciocalteu’s phenol reagent and sample preparation from 30 mg of Ocimum basilicum leaf 3. The phenol/chloroform extraction with ethanol precipitation: Cetyltrimethylammonium bromide (CTAB) method demonstrated an increase in the amount of phenol in the final sample compared to samples prepared using the GenElute™-E Single Spin Plant Extraction Kit method and the silica column isolation method. The GenElute™-E Single Spin Plant Extraction Kit method and the silica column isolation method were very similar at removal of polyphenols endogenous in the plant sample. This indicates that there is a high likelihood that this inhibitor can impact the outcome of a PCR and choosing a purification method is important for removal (Figure 2).
Polyphenol Quantification

Figure 2.A) Average total phenol content of triplicate extracts from 30 mg of Ocimum basilicum leaf using three methods: GenElute™-E Single Spin Plant Extraction Kit, phenol/chloroform extraction with ethanol precipitation: Cetyltrimethylammonium bromide (CTAB) method, and a silica column isolation method. B) Concentrations were determined by comparing absorbance values to those obtained from a serial dilution of gallic acid (91215) at 13.75, 6.88, 3.44, and 1.72 µM 4.
Though the CTAB method may indicate higher yield of DNA by UV quantification, the presence of gallic acid in the final purified product suggests that polyphenols could lead to over-estimation of nucleic acid concentration causing poor performance in downstream PCR analysis. The gallic acid carry-over is not elevated with GenElute™-E Single Spin Plant Extraction Kit or the silica extraction method.
Suspected polyphenol inhibition of PCR enzymes
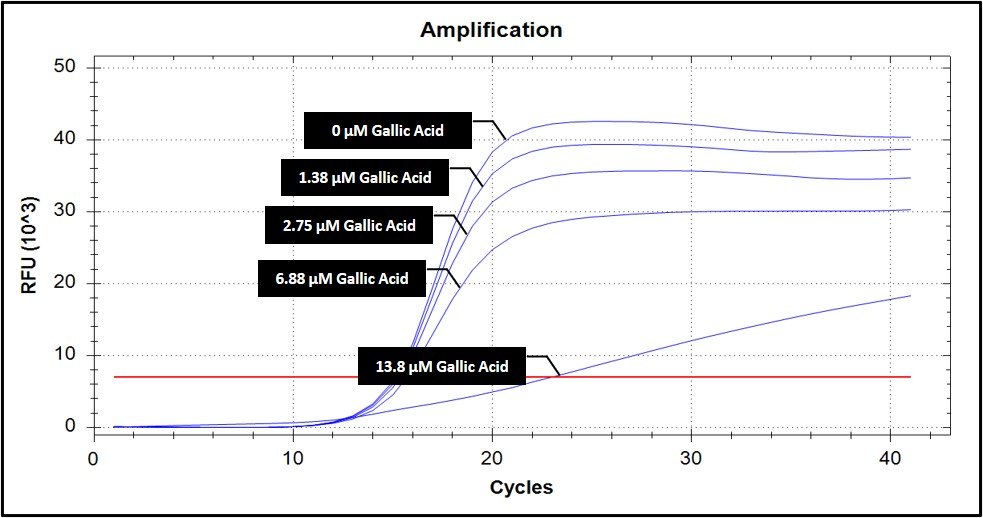
Polyphenols present in plant cells bind DNA and make downstream processing difficult as they will be co-precipitated with nucleic acids 2. It is therefore important to eliminate polyphenols prior to downstream PCR. We observed by gel electrophoresis (not shown) and qPCR, that PCR inhibition correlated with elevated gallic acid concentration. The greatest inhibition was observed at 13.8 µM gallic acid, the highest concentration tested (Figure 3).
Spiking assay of gallic acid in qPCR

Figure 3.Amplification curves from qPCR for the gene for Rubisco from Ocimum basilicum using a synthesized gene fragment (IDT) spiked with 2 µL of a titer of suspected PCR inhibitor gallic acid to represent polyphenols at 13.75, 6.88, 3.44, and 1.72 µM. Single replicate of duplicate reactions displayed for clarity 4.
DNA polymerase PCR master mix comparison
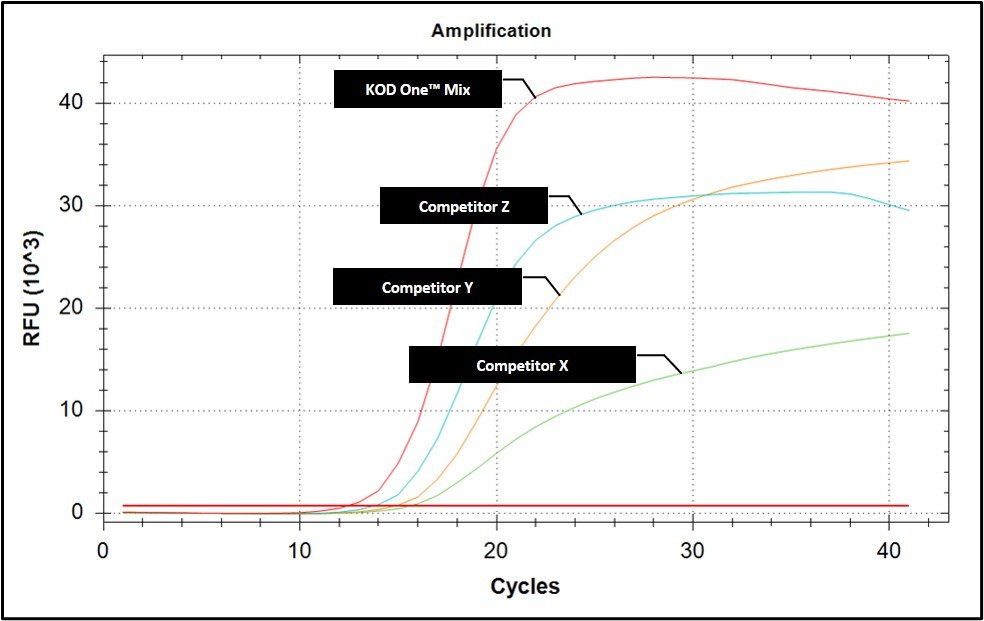
The selection of a robust PCR master mix may allow for improved performance despite the presence of inhibitory factors. KOD One™ PCR Master Mix and competitor high fidelity PCR master mixes were compared in qPCR (Figure 4) and gel electrophoresis (not shown). We observed that the KOD One™ PCR Master Mix appears to be the most robust with a lower Cq value even though the same template amount was used in all the reactions, indicating greater PCR efficiency (Figure 4). Of note, each PCR was performed with its manufacturer-recommended elongation temperature. KOD One™ PCR Master Mix utilizes a lower elongation temperature (68°C) than all the other master mixes tested (72°C). This lower temperature reduces the time needed for the thermocycler to ramp between temperatures in each cycle, reducing the time needed for PCR completion.
Amplification curve comparison of PCR master mix solutions in qPCR.

Figure 4.Amplification curves were compared in qPCR for the gene for Rubisco from Ocimum basilicum using a 1420 bp synthesized gene fragment (IDT) using KOD One™ PCR Master Mix (red), and competitor high fidelity PCR master mixes. Each extension step was performed at the manufacturer’s recommended elongation temperature for the enzyme. Single replicate of duplicate reactions displayed for clarity.
The effects of PCR inhibitors and PCR enzyme selection on gDNA extraction and qPCR amplification
Quantification of gDNA extracted and polyphenol contamination concentrations were compared for GenElute™-E Single Spin Plant Extraction Kit, phenol/chloroform extraction with ethanol precipitation: cetyltrimethylammonium bromide (CTAB) method, and a silica column isolation method from the leaf tissue of Ocimum basilicum to establish the efficiencies of gDNA isolation in plant-based assays. While samples isolated via the phenol/chloroform extraction with ethanol precipitation: CTAB method resulted in the highest amount of gDNA via UV spectrophotometry, this is most likely due to polyphenol contamination leading to overestimation of the sample concentration. This contamination is observed with the polyphenol quantitation with an elevated concentration compared to GenElute™-E Single Spin Plant Extraction Kit and silica extraction methods. Analysis of the genomic DNA quantitation for each method suggests that the silica extraction method had the lowest yield, even with a second elution. Alternatively, results using the GenElute™-E Single Spin Plant Extraction Kit indicate robust extraction and low polyphenol contamination.
Suspected PCR inhibition by polyphenols was investigated in qPCR for plant-based target amplification of the gene for Rubisco. It was observed that PCR inhibition correlated with gallic acid concentration, indicating that endogenous inhibitors could lead to poor results in PCR. KOD One™ PCR Master Mix was also compared to other high fidelity PCR master mixes and had the most efficient qPCR and robust target amplification.
TRY GENELUTE™-E SINGLE SPIN PURIFICATION, REQUEST A SAMPLE!
GenElute™-E kits are based on the principle of negative chromatography using size exclusion. Impurities like salt, detergent, proteins and organic solvents are removed by the spin column, while the purified nucleic acid is collected in the flow-through – all in just one single centrifugation step. This convenient procedure enables a significantly faster purification of nucleic acid samples with less handling and reduced waste.
Materials and Methods
Sample preparation: Extractions were performed in triplicate. GenElute™-E Single Spin Plant Extraction Kit, phenol/chloroform extraction with ethanol precipitation: Cetyltrimethylammonium bromide (CTAB) method, and a silica extraction method. Five hole-punches (approximately 30 mg) of Ocimum basilicum leaf were used in each replicate and all samples were homogenized using a hand pestle. Sample yield was determined using a NanoDrop™ 2000.
Polyphenol quantification: Total phenol content was quantified utilizing Folin & Ciocalteu’s phenol reagent (F9252), sodium carbonate, Na2CO3 (S7796) and gallic acid (91215) utilizing a Synergy™ H1 Hybrid Reader 3.
PCR spiking assays: Primers (Forward: 5’GCCCGTTCCTGGAGAAAAAGA 3’, Reverse: 5’ CCCTGAAGCCACGGGAATAA 3’) were designed for the amplification of [GenBank: Z37424] Ribulose-1,5-bisphosphate carboxylase/oxygenase large subunit (Rubisco) 4. Template was a synthesized gene fragment (IDT), with KOD One™ PCR Master Mix and 1X EvaGreen™ dye. Amplification was performed at 95°C for 2 minutes, 40X (95°C for 20 seconds, 55°C for 20 seconds, 68°C for 50 seconds [read for SYBR]), 68°C for 5 minutes on BioRad CFX96 Touch Real-time thermocycler.
PCR set-up: Primers, template, and detection were as described in “PCR spiking assays” method. PCR master mixes tested were KOD One™ PCR Master Mix, and competitor high fidelity PCR master mixes in 50 µl reactions 4. Amplification was performed at 95°C for 2 minutes, 40X (95°C for 20 seconds, 55°C for 20 seconds, Gradient (60-72°C) for 50 seconds [read for SYBR]), Gradient (60-72°C) for 5 minutes on BioRad CFX96 Touch Real-time thermocycler. Each extension step was performed at the manufacturer’s recommended elongation temperature for the enzyme.
Materials
References
To continue reading please sign in or create an account.
Don't Have An Account?