Introduction
Bisphenol A (BPA) is commonly used for food packaging applications such as polycarbonate bottles, and the linings of metal cans used for soups, juices, etc. It is a suspected endocrine disruptor, and thus low level, long term exposure as a result of migration into food from packaging materials is a concern. The use of BPA in food contact applications is regulated by the Food and Drug Administration (FDA), and in 2013 was prohibited for use in the packaging materials of infant formula.1 For other food contact applications, margins of safety were published by FDA as “NOAEL”, which stands for “no observed adverse effect level”. This NOAEL was set at 5 mg/kg body weight per day, which is well above the estimated dietary intake.2 Similarly, tolerable daily intake or “TDI” was set by the European Union (EU) at 4 µg/kg body weight per day.3 While exposure to BPA through diet is thought to be low, testing continues in order to assess its migration into food from can and lid linings, plastic containers, etc. In the case of the EU, the specific migration limit (SML) for BPA from packaging into food has been amended in Sept 2018 to 0.05 mg/kg (formerly 0.6 mg/kg) food. In case of contact materials for food products with intended use for infants or young children, no BPA migration from coatings or varnishes is permitted at all.4
Extraction methods for determination of BPA in food include both solvent extraction (SE) and solid phase extraction (SPE), with the later more commonly used with liquid samples and the former for solid samples. Analysis can be done by either LC or GC, and both have been used throughout the literature. Solid phase microextraction (SPME) has been used for the determination of BPA in water, but has not been widely used for this application in food matrices due to sensitivity and fiber ruggedness issues associated with exposure to matrix components such as fats and proteins.5,6
The purpose of this application was to revisit the use of SPME to develop a quick, easy and sensitive method for analysis of BPA in a variety of food products. The issues mentioned previously related to food matrices and SPME were addressed through the use of an overcoated (OC) fiber. Since BPA is not volatile, using SPME requires immersion of the fiber directly into the matrix for sampling. In the case of some food samples, matrix components such as sugars, fats and dyes could contaminate the SPME fiber, shortening its lifetime. For these types of samples, a wash step is often incorporated into the method after extraction to remove any residual material on the surface of the fiber prior to desorption in the GC injection port. The effectiveness of this wash can be optimized by use of an OC SPME fiber. An SPME method was developed using an OC-divinylbenzene (DVB) fiber. The overcoating, which consists of polydimethylsiloxane (PDMS), protects the DVB layer from contamination, and increases the physical robustness of the fiber. In addition, material adhering to the overcoating is more easily removed during the wash step. SPME extraction using the OC-DVB fiber was followed by GC/MS/MS analysis for optimum sensitivity. The steps taken in method development and optimization will be described, as well as accuracy of the determination of BPA in a variety of matrices. Durability of the OC fiber compared to a standard, non-OC DVB fiber was also evaluated.
Experimental
The final, optimized SPME method using the OC fiber is described in Table 1. After extraction, the fiber was desorbed in the inlet of an Agilent 7890/7000C GC/MS/MS system, and analysis proceeded following the conditions listed in Table 2. The samples analyzed (canned pumpkin, pureed carrot baby food, cream of chicken soup and canned energy drink) were obtained from a local grocery store and refrigerated prior to testing. They were prepared for SPME by weighing 0.5 g into a 10 mL autosampler vial. Spiked samples for determination of accuracy and repeatability were spiked at 10 ng/g by direct addition of 5 µL of a 1 µg/mL solution of BPA in methanol to the 0.5 g sample. Samples were then allowed to equilibrate for 30-60 minutes. 6.5 mL of SPME diluent was added to each, followed by 7 µL of a 1 µg/mL methanolic solution of BPA-d16 internal standard. The SPME diluent consisted of LC/MS/MS grade water containing 25% salt (NaCl) by weight, and adjusted to pH=4 with phosphoric acid. To decrease BPA background from the laboratory, all measuring glassware and pipettes used were glass, and were triple rinsed with methanol prior to use. The salt used to make the SPME diluent was treated in a muffle furnace and stored in a glass jar prior to use.
Samples (spiked and unspiked) were quantitated against matrix-matched calibration curves prepared as described previously and extracted following the method in Table 1.
Results and Discussion
Method Optimization
A primary goal of method development was to determine single set of SPME parameters that could be used with multiple sample types. In the following paragraphs, optimization of critical parameters is described. Initially, experiments were conducted using phosphate buffer solution (PBS) spiked with BPA. Later it was found that the diluent could be simplified from PBS to deionized water without affecting extraction efficiency.
Salt and pH. Figure 1 shows the effect of salt and pH on the extraction of BPA from PBS spiked at 100 ng/mL. Addition of salt increased response significantly of both BPA and BPA-d16 (not shown). Decreasing pH from 7 to 4 also increased response, which leveled off at pH 2; thus a pH of 4 was chosen for further optimization Figure 2 shows the effect of salt concentration on the response of BPA extracted from water at pH 4 (spiked at 2.9 ng/mL). A steady increase in response was observed up to 25% salt, which represents the saturation point for water. The samples to be analyzed were very viscous, and required dilution prior to SPME; thus, a water diluent at pH 4 containing 25% salt was chosen for this purpose.
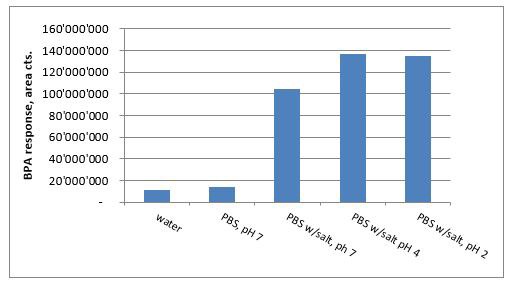
Figure 1.Effect of pH and salt on BPA response using the OC-DVB SPME fiber. PBS=phosphate buffer system (in water). Spiking level 100 ppb.
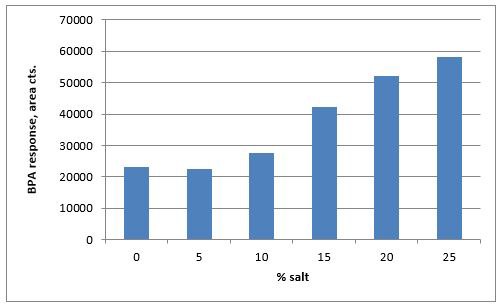
Figure 2.Effect of salt concentration on BPA response using the OC-DVB fiber. spiking level of 2.9 ng/mL in water, pH 4.
Interestingly, when working in different food matrices, it was found that the addition of salt did not always increase analyte uptake. Figure 3 shows a comparison of the effect of increasing salt concentration on the response of BPA from water, canned pumpkin and pureed carrot baby food. As with water, salt addition increased response from the carrot matrix, but did not affect response from the pumpkin matrix. Both carrot and pumpkin have similar water and sodium content, however pumpkin has about ten times more potassium. It is possible that this higher level of potassium increased the ionic strength of the diluted sample enough that the additional salt made no difference with regards to affecting uptake of BPA by the fiber. However, since the goal was to develop an SPME method that could be used with multiple types of samples, salt addition was included in the final optimized parameters.
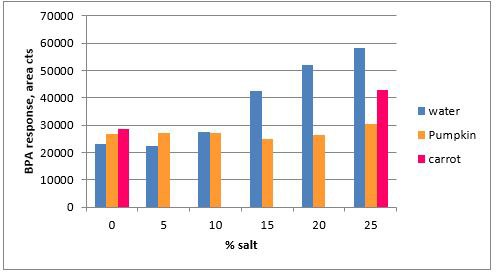
Figure 3.Effect of salt addition on response of BPA. diluted in water, pH 4; spiking level of 2.9 ng/mL.
Post-extraction wash. Since the method was to be used with food samples, incorporation of a post-extraction wash step was critical in removing residual matrix on the surface of the fiber prior to desorption in the GC inlet. Past work found this step to be more effective with the overcoated than the standard DVB fiber.7 Using water as the wash solution, different wash times were evaluated by extracting BPA from 25% salt water at pH 4 (Figure 4). The water was spiked at a very low level (0.1 ng/mL) to help magnify the impact of the wash step on response. Compared to no wash, a decline in response was observed up to 20 seconds, with little to no change from 20-30 seconds. To maximize washing, the 30 second time was chosen for the method. Since good response was still obtained, the loss in response compared to no/shorter wash time was not expected to severely impact the sensitivity of the method.
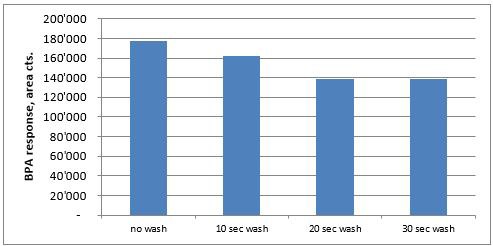
Figure 4.Evaluation of post-extraction wash time on BPA response from water containing 25% NaCl, pH 4; spiking level of 0.1 ng/mL.
For fattier samples, organic in the post-extraction wash solution can provide a more thorough cleaning of the fiber. Mayonnaise was originally a targeted matrix for this application; however the extremely high fat content produced too much background. Addition of organic solvent to the post-extraction wash solution was evaluated to determine if this background could be reduced. This approach was taken by deGrazia, et.al., for SPME analysis of pesticides from avocado using an overcoated fiber.8 The same solvent mixture used by these researchers, acetone:water, was evaluated (data not shown), however BPA response dropped after a 5 second wash, and decreased to an unacceptable level after 30 seconds. In addition, the acetone:water wash did not show any advantage over water alone for reducing the co-extracted background from the mayonnaise.
Extraction & equilibration conditions. Extraction times from 10 to 60 minutes were studied using 25% salt water at pH 4, spiked at 0.1 ng/mL). Response steadily increased from 10 to 50 minutes and then leveled off from 50 to 60 (Figure 5). Thus, 50 minutes was chosen as the extraction time. Equilibration time for this study was kept constant at 10 minutes with sample agitation at 400 rpm. These parameters were found to provide adequate conditions for mixing of the food samples with the diluent prior to extraction.
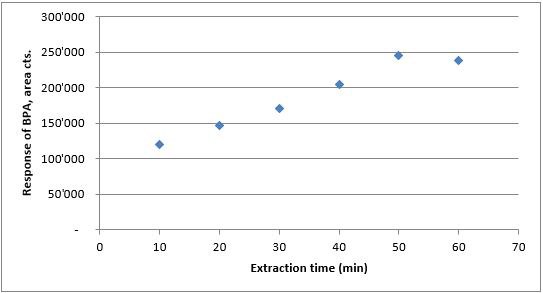
Figure 5.Extraction time vs. response from water, pH4 with 25% NaCl; spike level of 0.1 ng/mL.
Temperature can influence the kinetics of the extraction, especially when working in heavy matrix. The effect of extraction temperature was studied using pureed carrot baby food. Sample spiked at 10 ng/g was diluted using 25% salt water at pH 4. A sample size of 2 gm, mixed with 5 mL of diluent was used for the study. Triplicate samples were incubated and extracted at 30 °C, 40 °C and 50 °C (using a 50 minute extraction time and 30 second post extraction rinse for all). As seen in Figure 6, absolute response of BPA increased with temperature; thus 50 °C was chosen as the temperature for extraction and equilibration. The relationship observed between response and temperature was in agreement with previous work done by the author and colleagues in which the OC fiber was used to extract pesticides from spaghetti sauce.7
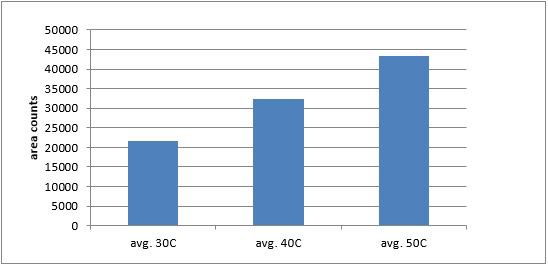
Figure 6.Effect of equilibration / extraction temperature on BPA response; pureed carrot baby food spiked at 10 ng/g. Average of 3 sample extractions at each temperature.
Sample size and dilution. With immersion SPME, sample mixing is important for good reproducibility during the extraction step. In developing a method that can be used for a variety of matrices, it was anticipated that some sample types would be too viscous for proper mixing and would have to be diluted. Initially, a 2 g sample diluted with 5 mL of salted water at pH 4 was used; however for very viscous samples such as canned pumpkin, this dilution was not enough to prevent material from sticking to the sides of the vial. After experimentation with different sample sizes/dilutions, 0.5 g diluted to 7 mL was found to work adequately for all the matrices evaluated, which included canned pumpkin, pureed carrots, condensed cream of chicken soup and a fruit flavored energy drink. In the case of the energy drink, the sample probably could have been analyzed undiluted.
BPA background. BPA is a common laboratory contaminant, thus a major challenge in its analysis by any approach is managing background. SPME requires minimal sample preparation steps and materials, so isolating sources of contamination can be less time consuming than other approaches such as liquid extraction or SPE. Some of the steps taken to reduce background for the SPME method were:
- use of methanol rinsed glass pipettes for spiking and dilution
- glass-bottled LC/MS/MS grade water for preparation of sample diluent
- muffle-furnace treatment of the sodium chloride used in the sample diluent solution
- storage of sample diluent in a glass bottle with a non-plastic cap
- increased septum purge setting on the GC system
Since BPA is highly soluble in methanol, this solvent was very effective as a cleaning rinse for glassware. Glassware was then dried at 60 °C. The SPME autosampler vials were used as is without a methanol rinse. Testing was done initially to determine if rinsing the vials with methanol prior to use reduced BPA background; however it did not have any significant effect and thus was not found to be necessary. The water used to make the sample diluent was LC/MS/MS grade in a glass bottle; chosen after it was found to have lower BPA background than deionized water generated from an in-house water system. The sodium chloride was supplied in a plastic container. Since the concentration of salt used in the samples is high, muffle-furnace treatment was done to eliminate any BPA that may have been picked up from the packaging. Finally, it was found that some BPA background was generated from puncturing the septum in the GC inlet, and this was reduced by increasing the septum purge from 3 to 6 mL/min.
Even with these measures, some BPA background was still present from the SPME process, however low level detection from samples was still possible.
Calibration. Since SPME is an equilibrium extraction technique, quantitation must be done against standards extracted using the same method as the samples. Analyte equilibrium constants can be greatly affected by matrix, thus it is sometimes necessary to use matrix-matched standards. In the case of BPA, extraction efficiency varied by matrix, thus matrix calibration had to be used for accurate quantitation. Figure 7 shows a comparison of the average responses of the internal standard, BPA-d16, from different matrices. As expected, response was the highest from the lightest matrix ; water, and decreased with heavier matrices. Thus, calibration using matrix-matched standards was used for each sample type. An unspiked sample for each was included as a “0” concentration point.
GC/MS/MS analysis. A common approach to the GC analysis of BPA is derivatization using silylation or acetylation. This improves peak shape and response, allowing for better quantitation.5,6 For this method, as seen in Figure 8, derivatization was not necessary to obtain sufficient chromatographic performance and response.
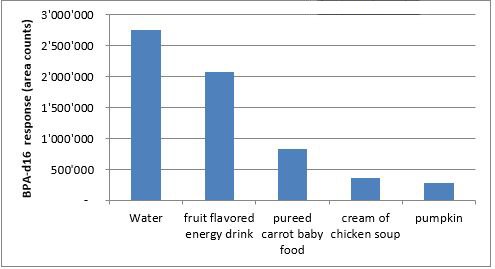
Figure 7.Effect of matrix on response. BPA-d16 spiked at 1 ng/mL in each sample.
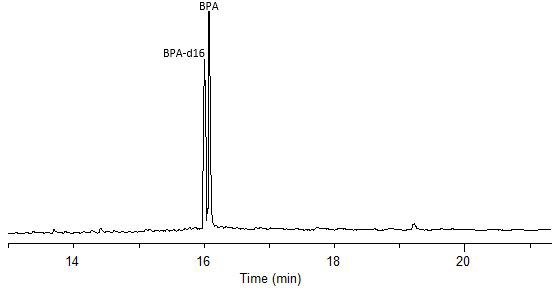
Figure 8.GC/MS analysis (full scan) of BPA and BPA-d16, underivatized, on the SLB®-PAHms. 10 ppm standard in methanol (see Tabel 2 for conditions).
SPME Method Performance
Analysis of spiked and unspiked samples. For all four matrices studied, both BPA and the internal standard, BPA-d16, could be detected free of interferences (Figures 9 a-d). As seen in Figure 10, the SPME method showed good linearity from these different matrices. The units are reported as ng/mL, which reflects the concentration of 0.5 g of sample diluted to a final volume of 7 mL prior to analysis. Converting these units to weight based on this sample size, the concentration range shown translates to 7 to 140 ng/g BPA. Accuracy and reproducibility of the method from these same matrices was determined by analysis of samples spiked at 10 ppb. The results of these evaluations are summarized in Table 3. Accuracy was >80% for all four matrices, with reproducibility as percent relative standard deviation (% RSD) or percent reproducibility (% RPD) of <15%. Since matrix-matched calibration curves were used to quantitate spiked samples, the level of BPA present in each sample prior to spiking could be determined with the “0” concentration or unspiked analysis using a standard addition approach. These values are reported in Table 4. The BPA detected in the carrot/baby food in the glass jar was probably a result of leaching from the lined cap, and the level detected is in the range found by others in the analysis of baby food in glass jars with metal lids.9 In the canned samples, the highest level of BPA was detected in the cream of chicken soup. However, this level was still lower than past BPA levels determined by others in canned chicken soup.10 It should also be noted that the soup was analyzed directly without water dilution. Normal preparation for consumption requires a 1:1 dilution with water, which would essentially cut the BPA level by 50%.
Figure 9. SPME-GC/MS/MS analysis of BPA spiked at 10 ppb in various matrices. (a) fruit flavored energy drink; (b) pureed carrots baby food; (c) condensed cream of chicken soup; (d) canned pumpkin.
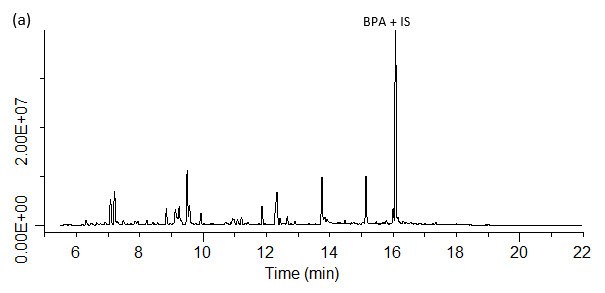
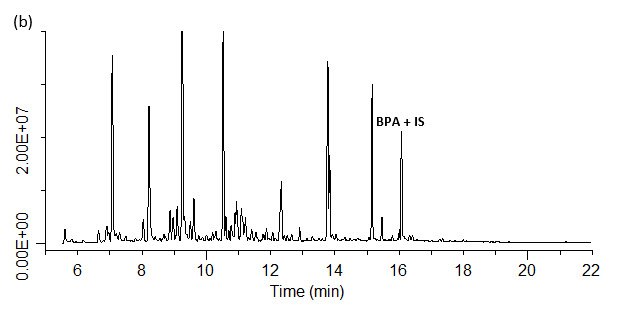
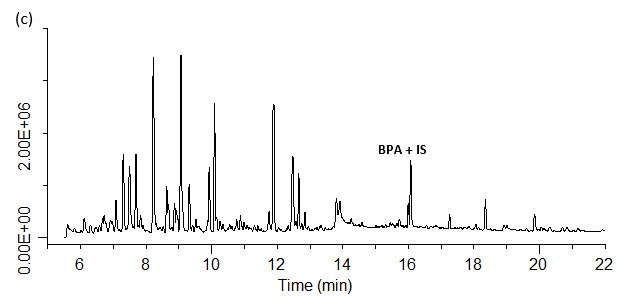
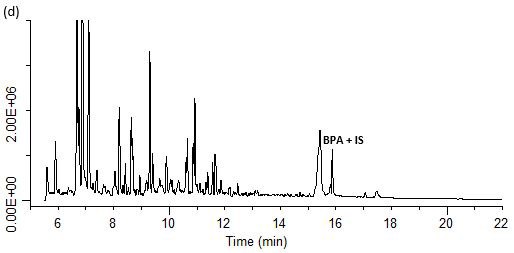
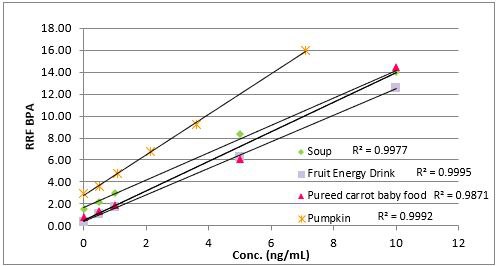
Figure 10.BPA / SPME method linearity from different matrices.
*%RPD, 2 replicates
Fiber durability and method ruggedness. As mentioned previously, when doing immersion SPME into heavy matrices, a post extraction wash step is essential in removing residual matrix prior to the desorption step in the GC inlet. A comparison of fiber durability and method ruggedness between the OC and standard, non-overcoated versions of the PDMS/DVB fiber was conducted by subjecting both to multiple extractions of canned pumpkin samples. Separate samples of pumpkin were weighed out and spiked at 10 ppb with BPA-d16. These were then run in a continuous sequence with 1 ng/mL BPA/BPA-d16 spiked water samples run every 6th extraction. The results are shown in Figure 11. For purposes of studying the trend in response, area counts were normalized to the first sample extraction. In 25 extractions of pumpkin using the OC fiber, response did not show a significant decline. The condition of the fiber after the testing sequence was fairly good, with some discoloration but no evidence of physical damage (Figure 12). By comparison, the standard fiber run was stopped after 18 extractions, as the coating had stripped completely off the fiber core (Figure 13). The response trend was erratic, as seen in Figure 11. It is not known exactly when the coating stripped from the fiber during the course of the 18 extractions. The experiment was then repeated using a new standard fiber. However, during the testing sequence, the plunger on the fiber bent, which destroyed the fiber. It is very likely that the coating again stripped from the fiber, but this time it collected around the opening of the needle assembly, causing the plunger to jam when the fiber was retracted back into the needle at some point. The findings of the durability testing indicate that either the overcoating is protecting the phase from damage as a result of exposure to the pumpkin matrix, and/or the post-extraction wash step is more effective for the OC fiber at removing residual matrix. This then helps to prolong fiber life.
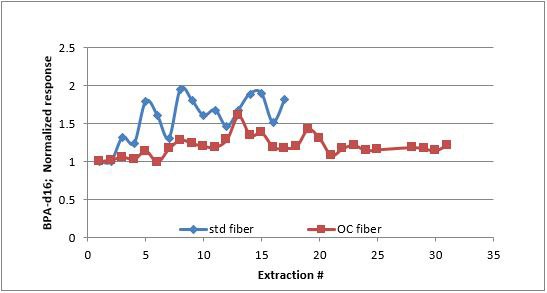
Figure 11.Response trend of BPA-d16 from spiked pumpkin samples over repeated extractions. Response is normalized to the first sample.
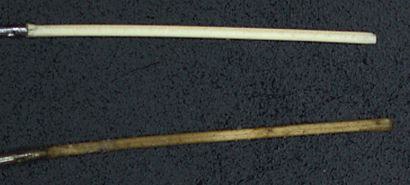
Figure 12.Overcoated fiber after 29 extractions of canned pumpkin. For comparison, an unused fiber is shown above the used fiber.
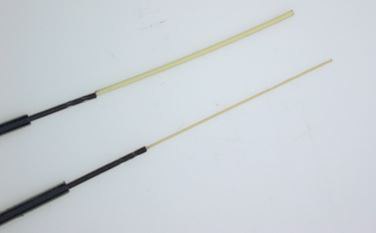
Figure 13.Standard fiber after 18 extractions of canned pumpkin. Note the lack of coating, which stripped off during the course of the extractions. For comparison, an unused fiber is shown above the used fiber.
Summary and Conclusions
An immersion SPME- GC/MS/MS method using an overcoated PDMS/DVB fiber was developed for the low level analysis of BPA from various food products. During method development, pH adjustment and the addition of salt were used to increase analyte response. A dilution step was also incorporated to facilitate mixing of vary viscous samples. Method linearity from different matrices; a fruit flavored beverage, canned pumpkin, pureed carrot baby food, and cream of chicken soup was in the range of 0.9871 (carrots) to 0.9995 (beverage). Method accuracy and reproducibility at a 10 ppb spiking level was between 80-110%, with RSD/RPD values of <15%. Durability of the overcoated fiber was evaluated with repeated extractions of canned pumpkin samples. Compared to a standard PDMS/DVB fiber, the OC fiber was more physically robust and showed more consistent response, while the coating on the standard fiber stripped after < 20 sample extractions. For the OC fiber, this robustness is presumed to be due to the physical protection afforded to the fiber coating by the PDMS overcoat, and the greater effectiveness of the post-extraction wash step. The SPME method had few steps; weighing of the sample and dilution with salted water, and was easy to automate. In addition, it was highly sensitive, and when combined with GC/MS/MS, provided the selectivity necessary to be used with different matrices.
Materials
如要继续阅读,请登录或创建帐户。
暂无帐户?