In-Line Real-Time Monitoring of CHO Cell Culture Process Parameters using Raman Spectroscopy
Read More About
- The Challenges of Monitoring Critical Cell Culture Parameters
- Case Study: In-Line and Real-Time Monitoring of CHO Cell Culture With Raman Spectroscopy
- Materials and Methods
- Chemometric Model Building With Bio4C® PAT Raman Software
- Comparison of Raman Measurements With Off-Line Sampling Methods
- Improving Efficiency and Control in Biopharmaceutical Manufacturing
The Challenge of Monitoring Critical Cell Culture Parameters
Typically, only a handful of parameters such as temperature, pH, and dissolved oxygen (DO) are measured and controlled in real time during cell culture processes. While an understanding of these parameters is essential for a robust process, they provide only broad assumptions about the state of the culture and offer limited insights into the process and cell growth.
In contrast, critical process parameters (CPP) such as glucose, lactate, or ammonium and key performance indicators (KPI) such as total cell density (TCD) and viable cell density (VCD) provide direct indication of the content and state of a culture. However, if these parameters are measured off-line, the measurements cannot provide real-time information and process control can only happen with a significant delay. In addition, the requirement for frequent, manual sampling increases the risk of batch failures due to contamination. Implementing process analytical technology (PAT) for automated in-line, real-time measurements allows to navigate cell culture processes with an improved process understanding and decreased process risk, enabling more advanced process control.
Case study: In-line and Real-time Monitoring of CHO Cell Culture With Raman Spectroscopy
Raman spectroscopy can be used to perform in-line and real-time measurement of TCD, VCD and mAb titer as well as the concentration of glucose, lactate, and ammonium in a bench-scale bioreactor. This PAT approach identifies and determines the concentration of molecules in solution. When monochromatic light is shown on a sample or a molecule of interest, it is scattered, and the energy transfer between the photon and the molecule causes a shift in the emitted wavelength. The change in wavelength provides information about the vibrational, rotational, and other frequency transitions associated with the molecule. Based on this information, characteristics of the molecule can be defined, or the molecule itself can be identified.
Benefits of Raman spectroscopy which make it very well suitable for the application in cell culture include:
- High molecular specificity
- Excellent reproducibility
- Suitability for aqueous solutions due to low water interference
- Possibility to monitor multiple parameters simultaneously
- Non-destructive nature of measurement (through an inserted probe)
- In-line and real-time measurements
In this study, ProCellics™ Raman Analyzer with Bio4C® PAT Raman Software (the Raman PAT Platform) was used to monitor CHO cell culture parameters. Results were compared to more traditional off-line measurements to assess suitability of the technology for cell culture application.
Materials and Methods
FreeStyle™ CHO-S cells were inoculated at 0.4 x 10⁶ cells/mL in Gibco™ CD-CHO medium with 8 mM glutamine, 1% Gibco™ anticlumping agent (all by ThermoFisher Scientific, Waltham, MA, USA) and 0.5% of penicillin/streptomycin in a water jacketed 3 L glass bioreactor. Bioreactor settings are provided in Table 1.
The cultures were fed with Gibco™ CHO CD EfficientFeed™ B (ThermoFisher Scientific) feed solution with 15% v/v on day zero and 10% v/v on day three, six and nine. When glucose concentration dropped below 4 g/L, a highly concentrated glucose solution was added. Glutamine was added when the concentration dropped below 4 mM, and constant glutamine feeding began on day three. Samples were collected twice a day when no feed was performed. For each feed, a sample was taken before and after the feed in addition to the daily sample. All samples were taken in triplicate and each triplicate was analyzed using an automated analyzer for quantitation of TCD, VCD, glucose, lactate, and ammonium.

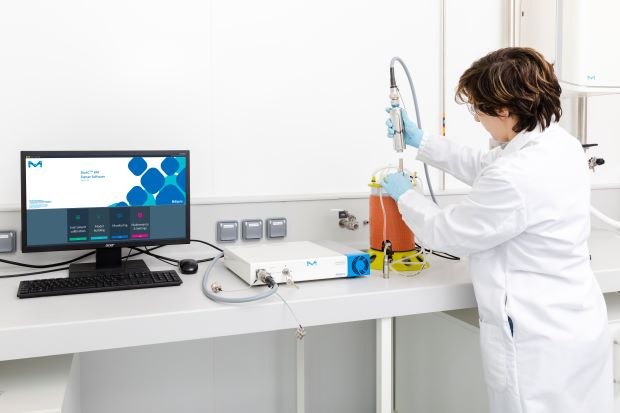
Figure 1:ProCellics™ Raman Analyzer probe immersed into the bioreactor. The instrument is controlled by Bio4C® PAT Raman Software.
Raman measurements were performed using the ProCellics™ Raman Analyzer with Bio4C® PAT Raman Software. The optical probe of the ProCellics™ Raman Analyzer was directly immersed into the bioreactor using a PG13.5 cable gland adaptor as shown in Figure 1. Each measurement represents an average of 20 spectra of 45 seconds (15 minutes of acquisition in total) and measurements were scheduled every 30 minutes.
Chemometric Model Building with Bio4C® PAT Raman Software
Off-line data from three cell culture runs (a total of 76 points for all parameters and 73 for glucose) were automatically linked to their corresponding Raman spectra to generate a dataset in the Bio4C® PAT Raman Software. The spectra were preprocessed in the software using Standard Normal Variate on the water region, Savitzky-Golay derivative with 5 points (15 cm-1, polynomial order 2 and a 1st derivative) and spectral selection (350 - 1,775 cm-1 + 2,800 - 3,000 cm-1) to create a calibration dataset.
A partial least squares (PLS) model was built for each process parameter (TCD, VCD, and concentrations of glucose, lactate, and ammonium) using a multivariate analytics modeling software. Chemometric models were uploaded in the Bio4C® PAT Raman Software and used to perform in-line and real-time monitoring of process parameters for a new cell culture run from the acquired Raman spectra (Figure 2).

Figure 2:Real-time monitoring of a CHO cell culture (red: TCD, light blue: VCD, orange: ammonium, pink: glucose, purple: lactate).
Comparison of Raman Measurements with Off-line Sampling Methods
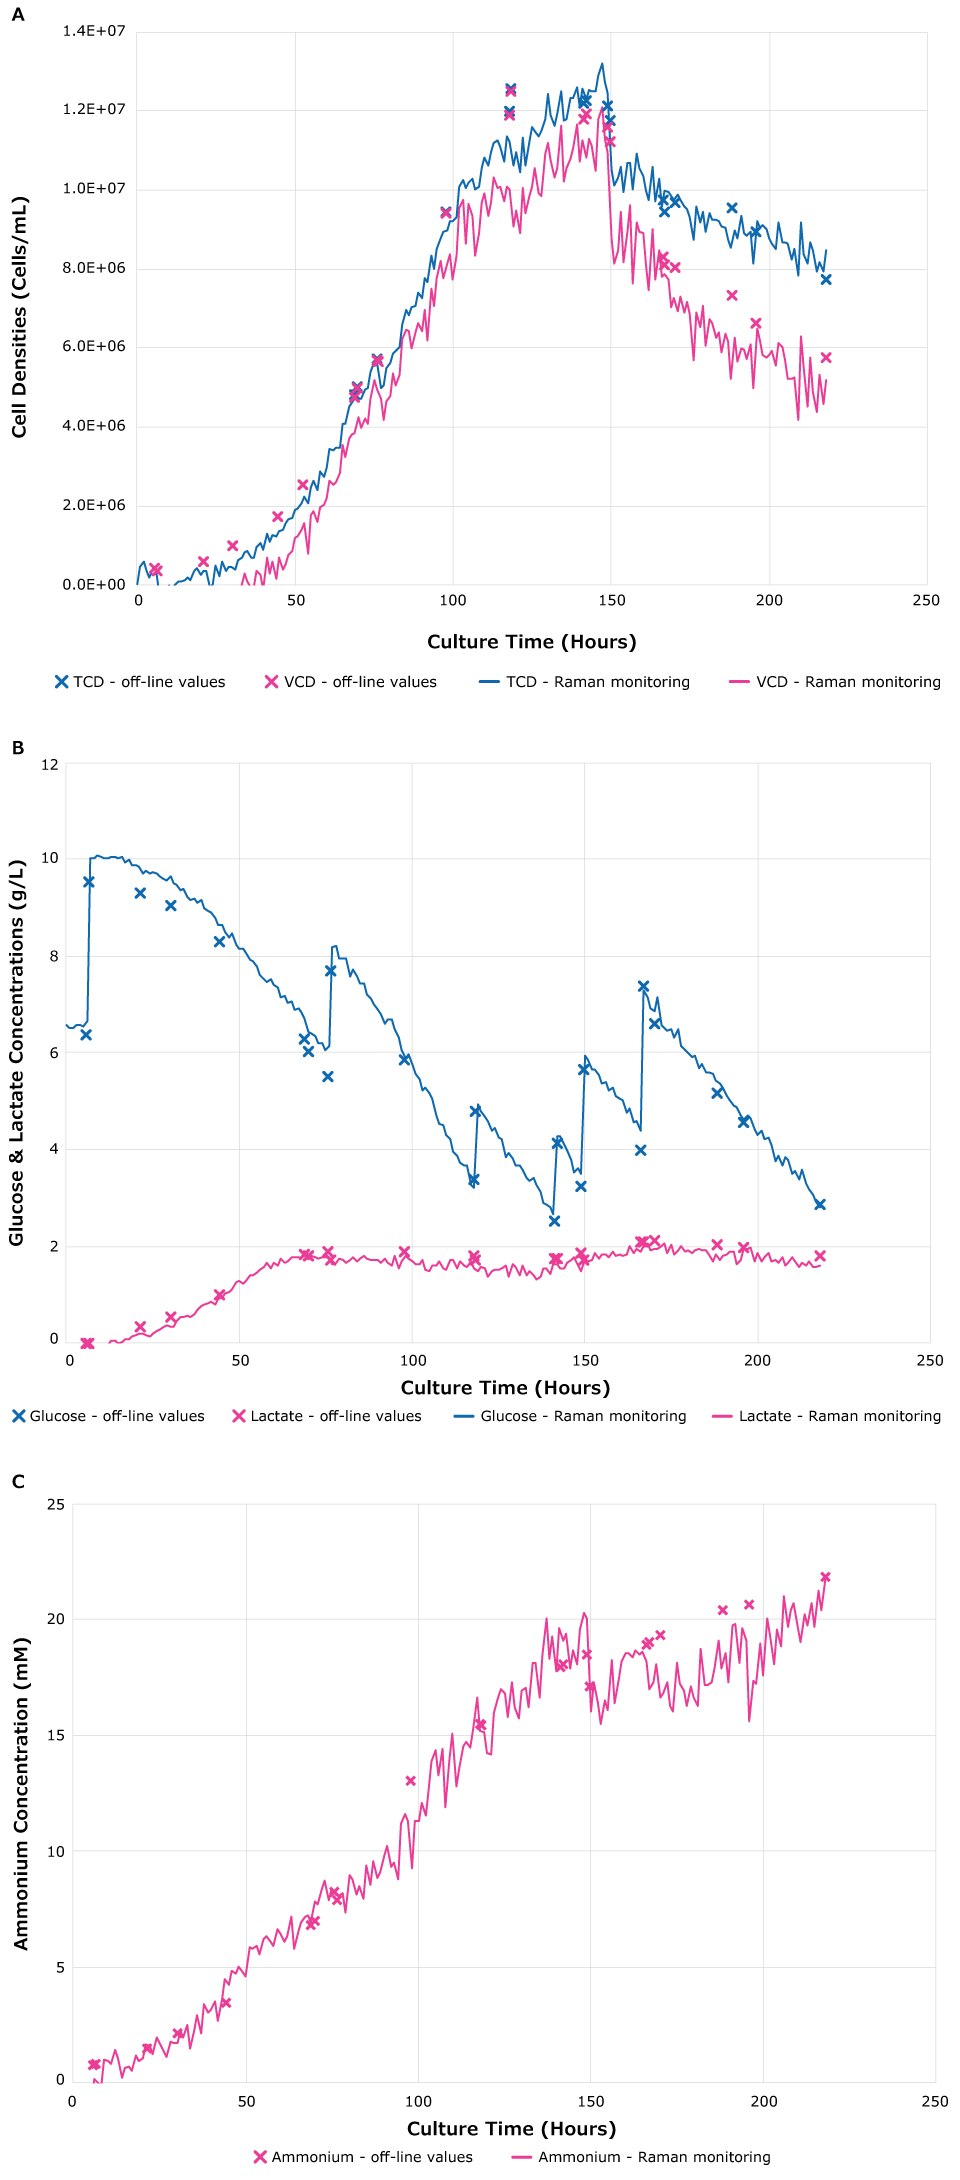
Accuracy of the Raman measurements were compared with traditional off-line sampling methods. The root mean square error of prediction (RMSEP) and its percentage error were calculated for each parameter and are shown in Table 2. Measurement plots comparing in-line and real-time Raman to off-line measurement values for TCD, VCD, glucose, lactate, and ammonium are shown in Figure 3.

Figure 3:Comparison of off-line measurements and real-time monitoring performed by ProCellics™ Raman Analyzer with Bio4C® PAT Raman Software of total cell density (TCD), viable cell density (VCD), glucose, lactate, and ammonium.
For the measurement of cell densities, real-time monitoring and off-line values showed the same cell growth kinetics trend (Figure 3A). On day 6, addition of a large volume of feed led to a cell dilution that was successfully monitored by the ProCellics™ Raman Analyzer with Bio4C® PAT Raman Software. At the end of the culture, the total and viable cell densities were clearly distinguished using the Raman method which also enabled real-time tracking of the decrease of cell viability. In this study, the total and viable cell densities were predicted in real-time with an error of 5% and 10%, respectively (Table 1).
Real-time measurement errors are 4% for glucose, 8% for lactate and 7% for ammonium (Table 1). As shown in Figure 3B and 3C, real-time measurements are consistent with off-line data throughout the duration of the culture. All increases of glucose level following the feeds were accurately monitored by Bio4C® PAT Raman Software.
Improving Efficiency and Control in Biopharmaceutical Manufacturing
The case study confirms the suitability of the ProCellics™ Raman Analyzer with Bio4C® PAT Raman Software as an in-line and real-time measurement platform for critical process parameters and key performance indicators in cell culture processes such as glucose, lactate, ammonium, as well as total and viable cell density.
By providing significantly more data in real time, this approach provides greater insights into cell culture processes, overcoming limitations of off-line measurements. The platform's ability to provide real-time analytical data significantly enhances process control and reproducibility, providing an opportunity for improved yield and quality. Moreover, use of the platform can also mitigate the risk associated with manual sampling, reducing the likelihood of contamination and batch failure. Additionally, it can be used as part of an automated nutrient control loop strategy to reduce off-line sampling and manual feeding, a first step toward process automation. The innovative one-batch approach as a robust calibration method renders Raman technology easily scalable and adaptable to process changes. In conclusion, the application of Raman technology using the ProCellics™ Raman Analyzer with Bio4C® PAT Raman Software empowers comprehensive process understanding and control in biopharmaceutical manufacturing, enabling users to make the right decisions with confidence.
LEARN MORE ABOUT PAT
To continue reading please sign in or create an account.
Don't Have An Account?