Improving Bioprocess Monitoring and Control with Multivariate Data Analysis
Section Overview
- Using PCA and PLS to Build a Process Monitoring Tunnel
- Inter-stage and Intra-Stage Process Monitoring Tunnels
- Recapping and looking ahead
Traditional approaches to biomanufacturing monitoring have relied too heavily on individual critical process parameters to maintain critical quality attributes. Manual tracking and monitoring of interactions between critical process parameters and quality attributes is not only time-consuming and labor-intensive but also delay informed decisions on batch performance.
Recent advances, however, have made possible a proactive, near real-time approach to monitoring, controlling, and predicting quality and productivity in biomanufacturing processes. This approach is founded upon the use of multivariate data analysis (MVDA) to extract valuable insights from complex, multidimensional data sets common to bioprocessing.
MVDA methods, such as statistical dimension reduction and regression tools, are particularly useful in this area. Principal component analysis (PCA) can be used to monitor and analyze complex multivariate data sets obtained from process parameters. Partial least squares (PLS) regression can be used to predict the future state of a batch based on current real-time measurements. When used together, these two statistical methods provide a concise, coherent view of how a process is performing right now, and accurate predictions of the health of a batch well in advance of lab testing.
While it is possible for companies to build their own custom software that collects relevant bioprocess data from disparate sources and applies the statistical methods needed to analyze it, such a project requires specialized software development skills and is difficult and costly to scale and maintain. More often, it is faster and more cost-effective to deploy proven software solutions than in-house builds. Not only does such a solution streamline data collection and analytics, it also provides key visualizations that process engineers need to quickly assess process performance. With near real-time insights into batch health and accurate predictions for the future state and end state of the process, biomanufacturers can move closer to optimal steady-state operation.
Using PCA and PLS to Build a Process Monitoring Tunnel
As one of most widely used MVDA techniques for reducing the dimensionality of data, PCA involves transforming a data set with many variables into a new set with far fewer variables, called principal components, that capture most of the variability in the original data set. Rather than trying to analyze and understand hundreds of process parameters and their interactions, process engineers can, for example, check the first two principal components (PC1 and PC2) to quickly and easily assess overall process health.
At a high level, applying PCA in biomanufacturing begins with defining the variables to be used in the analysis, including critical process parameters (CPPs) and other process variables, critical quality attributes (CQAs), and raw material properties. After data for these variables are collected, preprocessing is performed to clean them, normalize them, and remove outliers. Next, PCA is performed on the preprocessed data, and visualizations – such as a scores plot, loadings plot, contributions plot, and Hotelling’s T2 – are used to assess the resulting PCA model.

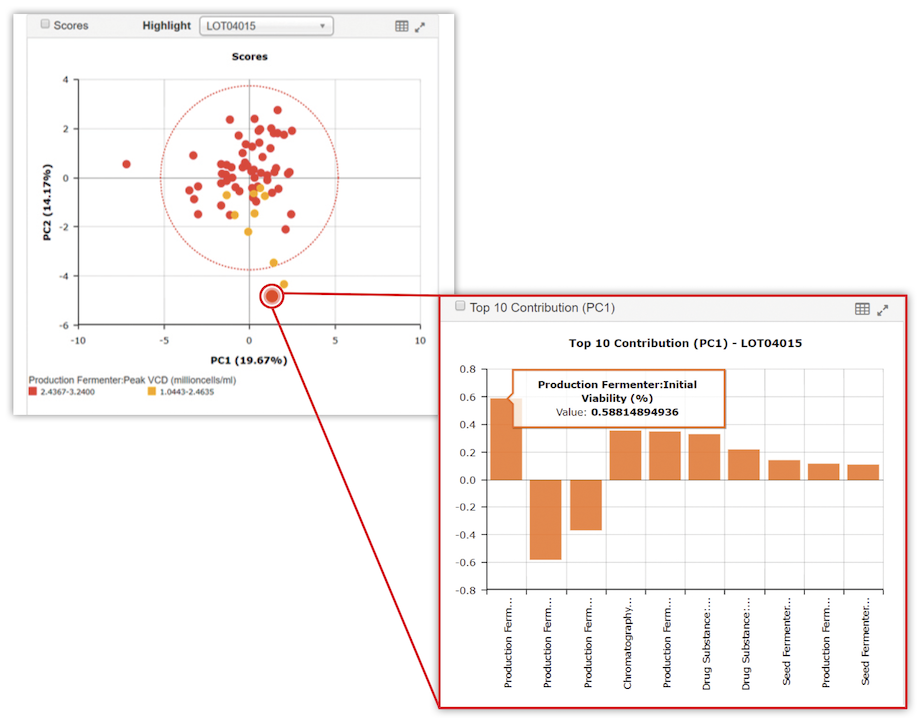
Figure 1: Two PCA plots from Bio4C ProcessPad™ software:a scores plot, which shows the amount of variation each PC captures from the data, and a contributions plot, showing the parameters that contribute the most to the first PC.
Principal components are not only used to analyze and visualize near real-time data from biomanufacturing processes, they are also used as input for predictive models based on PLS regression. Engineers apply these models to predict how the process will progress over time.
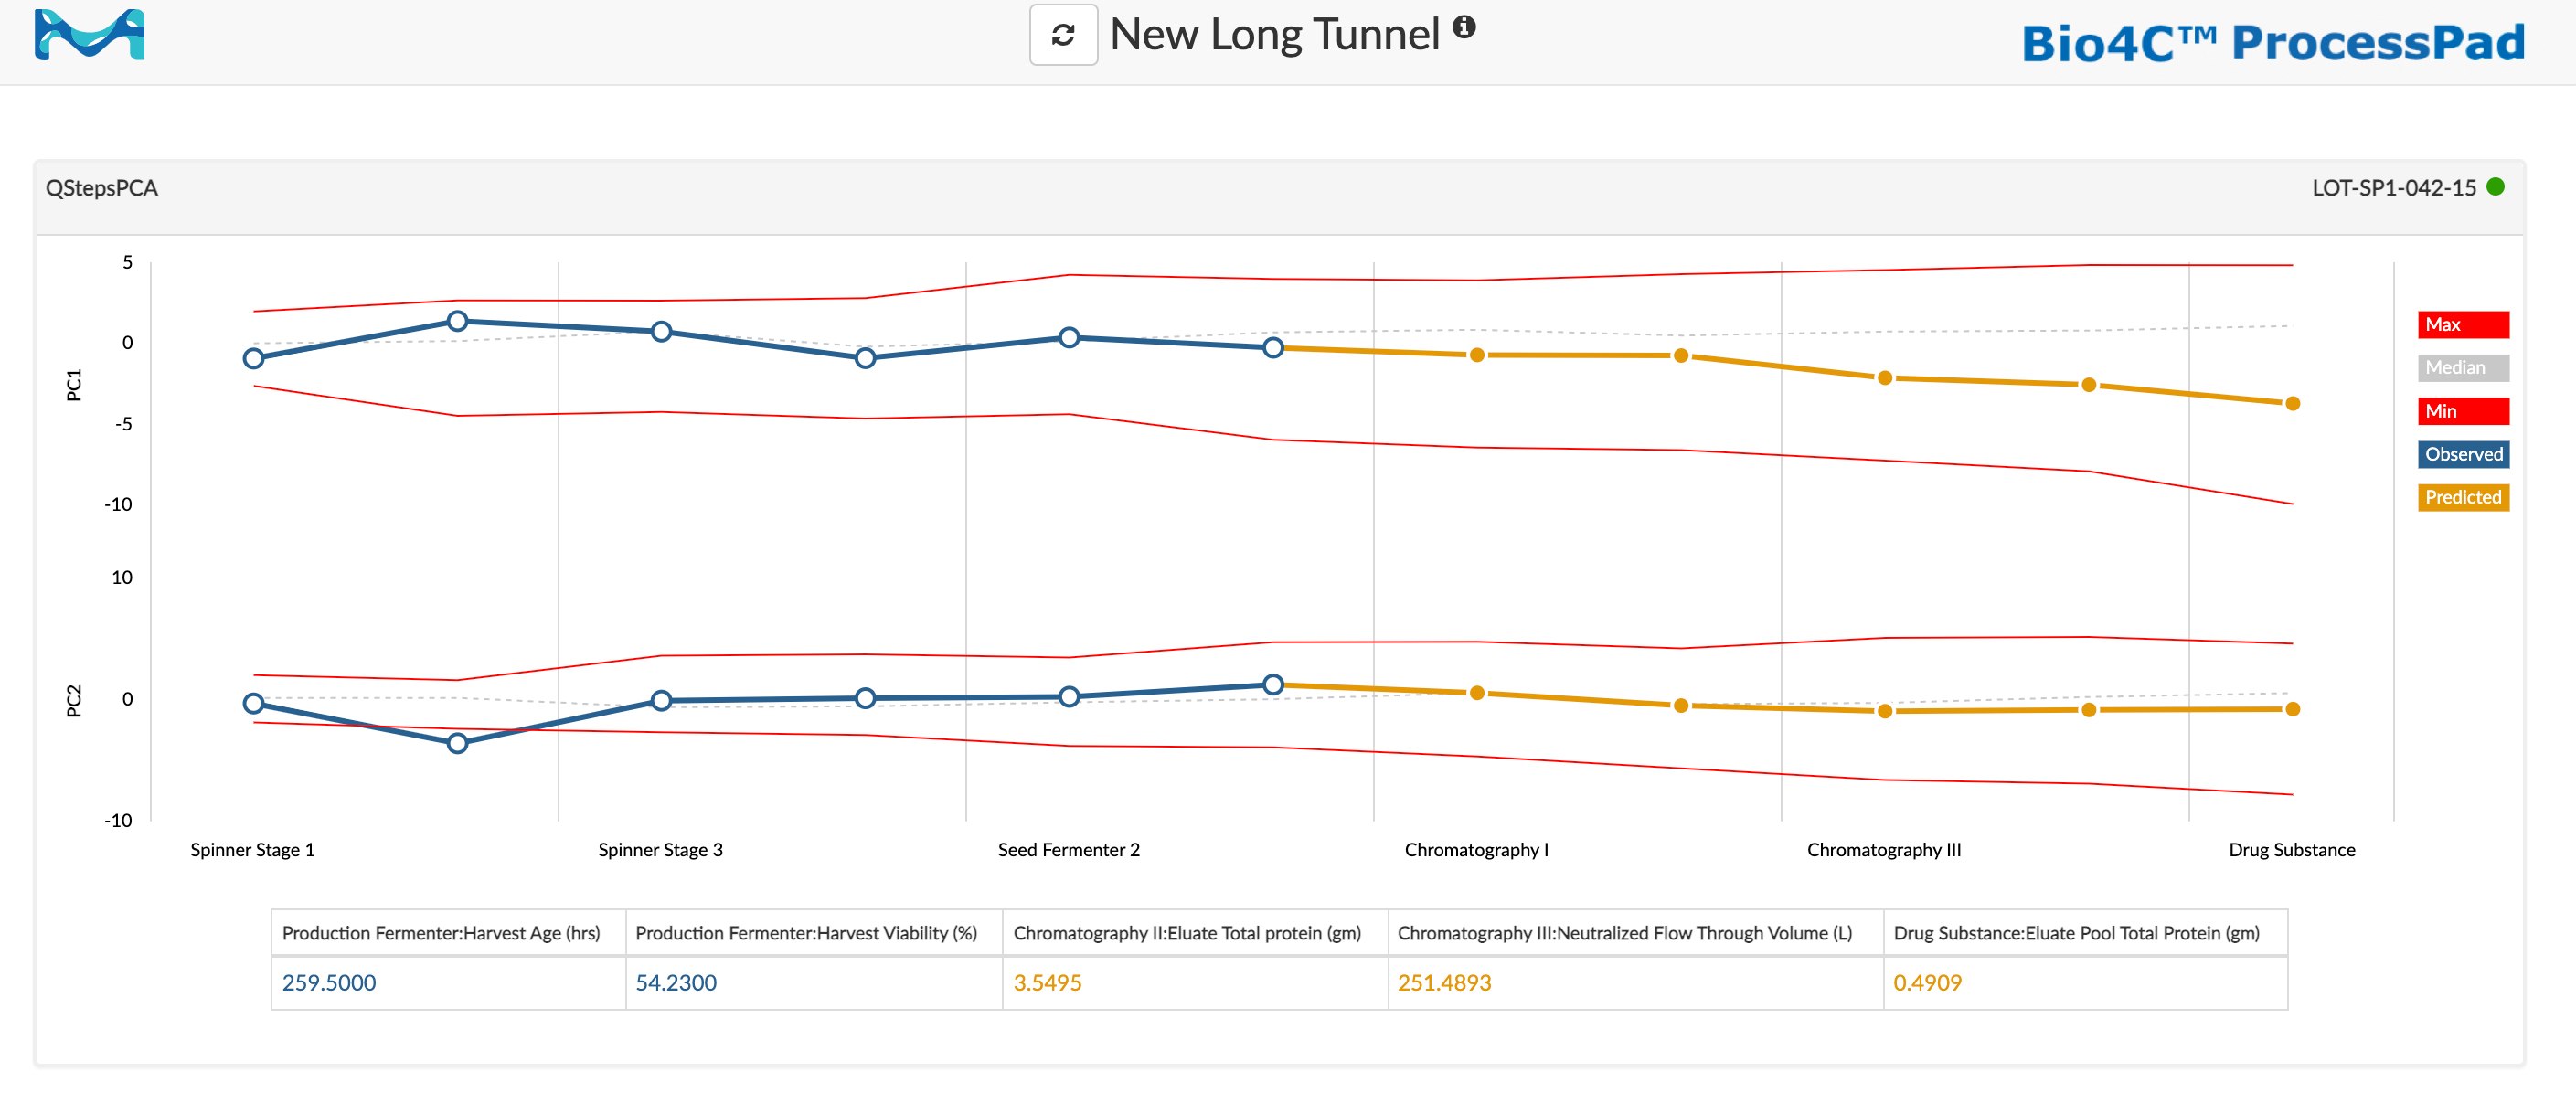
Among the most intuitive visualizations of process health based on PCA and PLS regression is a process monitoring tunnel, which provides a graphical representation multivariate score ranges at each stage (or within a single stage) of the manufacturing process. Specifically, the upper and lower bounds of the tunnel are defined by the maximum and minimum values of the range, respectively. For a given principal component, the process monitoring tunnel will show the minimum, maximum, and mean values for that component derived from batches that have been determined to have the desired values for CPPs and CQAs. Crucially, the process monitoring tunnel chart also shows the observed value for the principal component for the current batch, and the predicted value for the principal component as the batch progresses into subsequent stages.

Figure 2:process monitoring tunnel in Bio4C ProcessPad™ software showing minimum, maximum, mean, observed, and predicted values for PC1 and PC2 across six process stages.
Process monitoring tunnels offer a wide range of benefits to biomanufacturers, including near real-time monitoring of batch performance, early anomaly detection, accelerated root-cause investigations, and quality prediction, as well as support for improving continuous process verification (CPV) programs and demonstrating proficiency to regulatory agencies.
Inter-stage and Intra-Stage Process Monitoring Tunnels
MVDA-based process monitoring tunnels can be used to visualize both inter-stage and intra-stage processes. An inter-stage process monitoring tunnel tracks progress across multiple unit operations – such as bioreaction, chromatography, and filtration – via a PCA-based batch progression model. An intra-stage process monitoring tunnel, in contrast, tracks progress within a single unit operation via a PCA-based time series model.
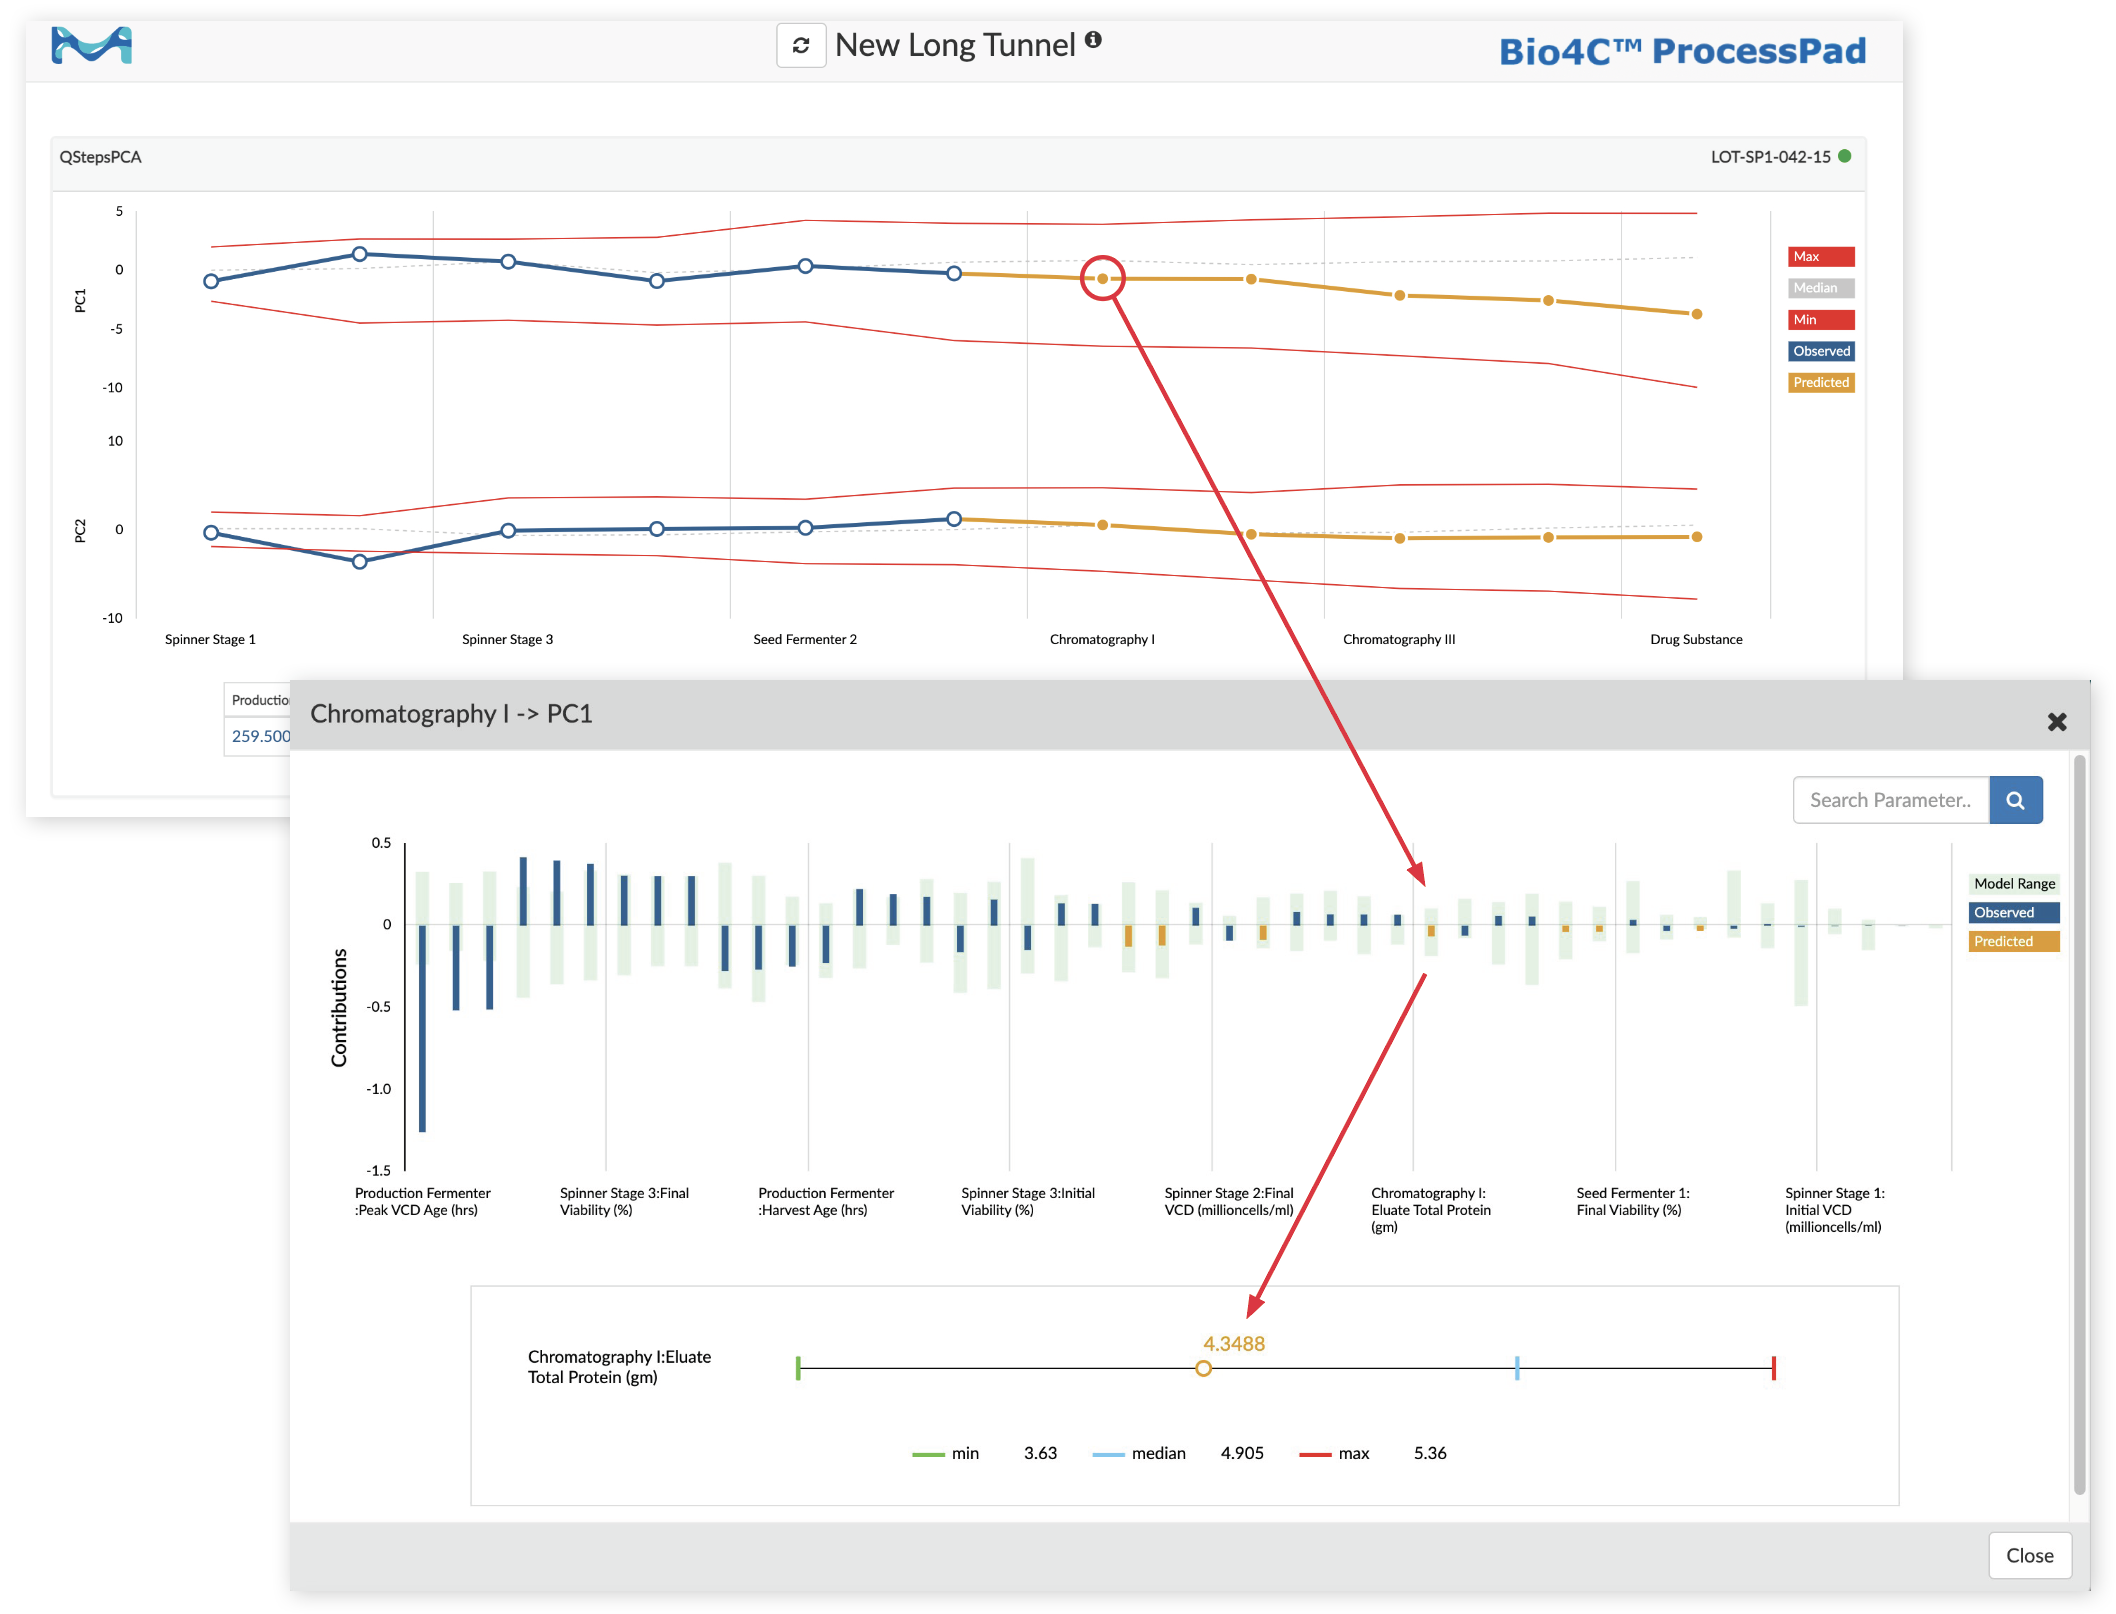
While both types of process monitoring tunnels provide concise overviews of process health, it is often necessary to investigate issues in greater detail. A key capability of the process monitoring tunnel enables research and engineering teams to drill down into the underlying data and identify those parameters that are currently contributing the most to the process’s state and those parameters that are predicted to contribute the most in upcoming processing steps.
Making use of this capability with an inter-stage processing tunnel, teams can proactively plan operations and logistics for upcoming stages. For example, consider a process currently running on culture day 4 of a production bioreactor. If, based on the current state, the process monitoring tunnel shows the estimated harvest age to be culture day 12, then the team can not only better plan for harvest and clarification operations but also prepare raw materials and buffers for downstream stage operations.

Figure 3:Drilling down into a chromatography unit operation in a Bio4C ProcessPad™ software process monitoring tunnel.
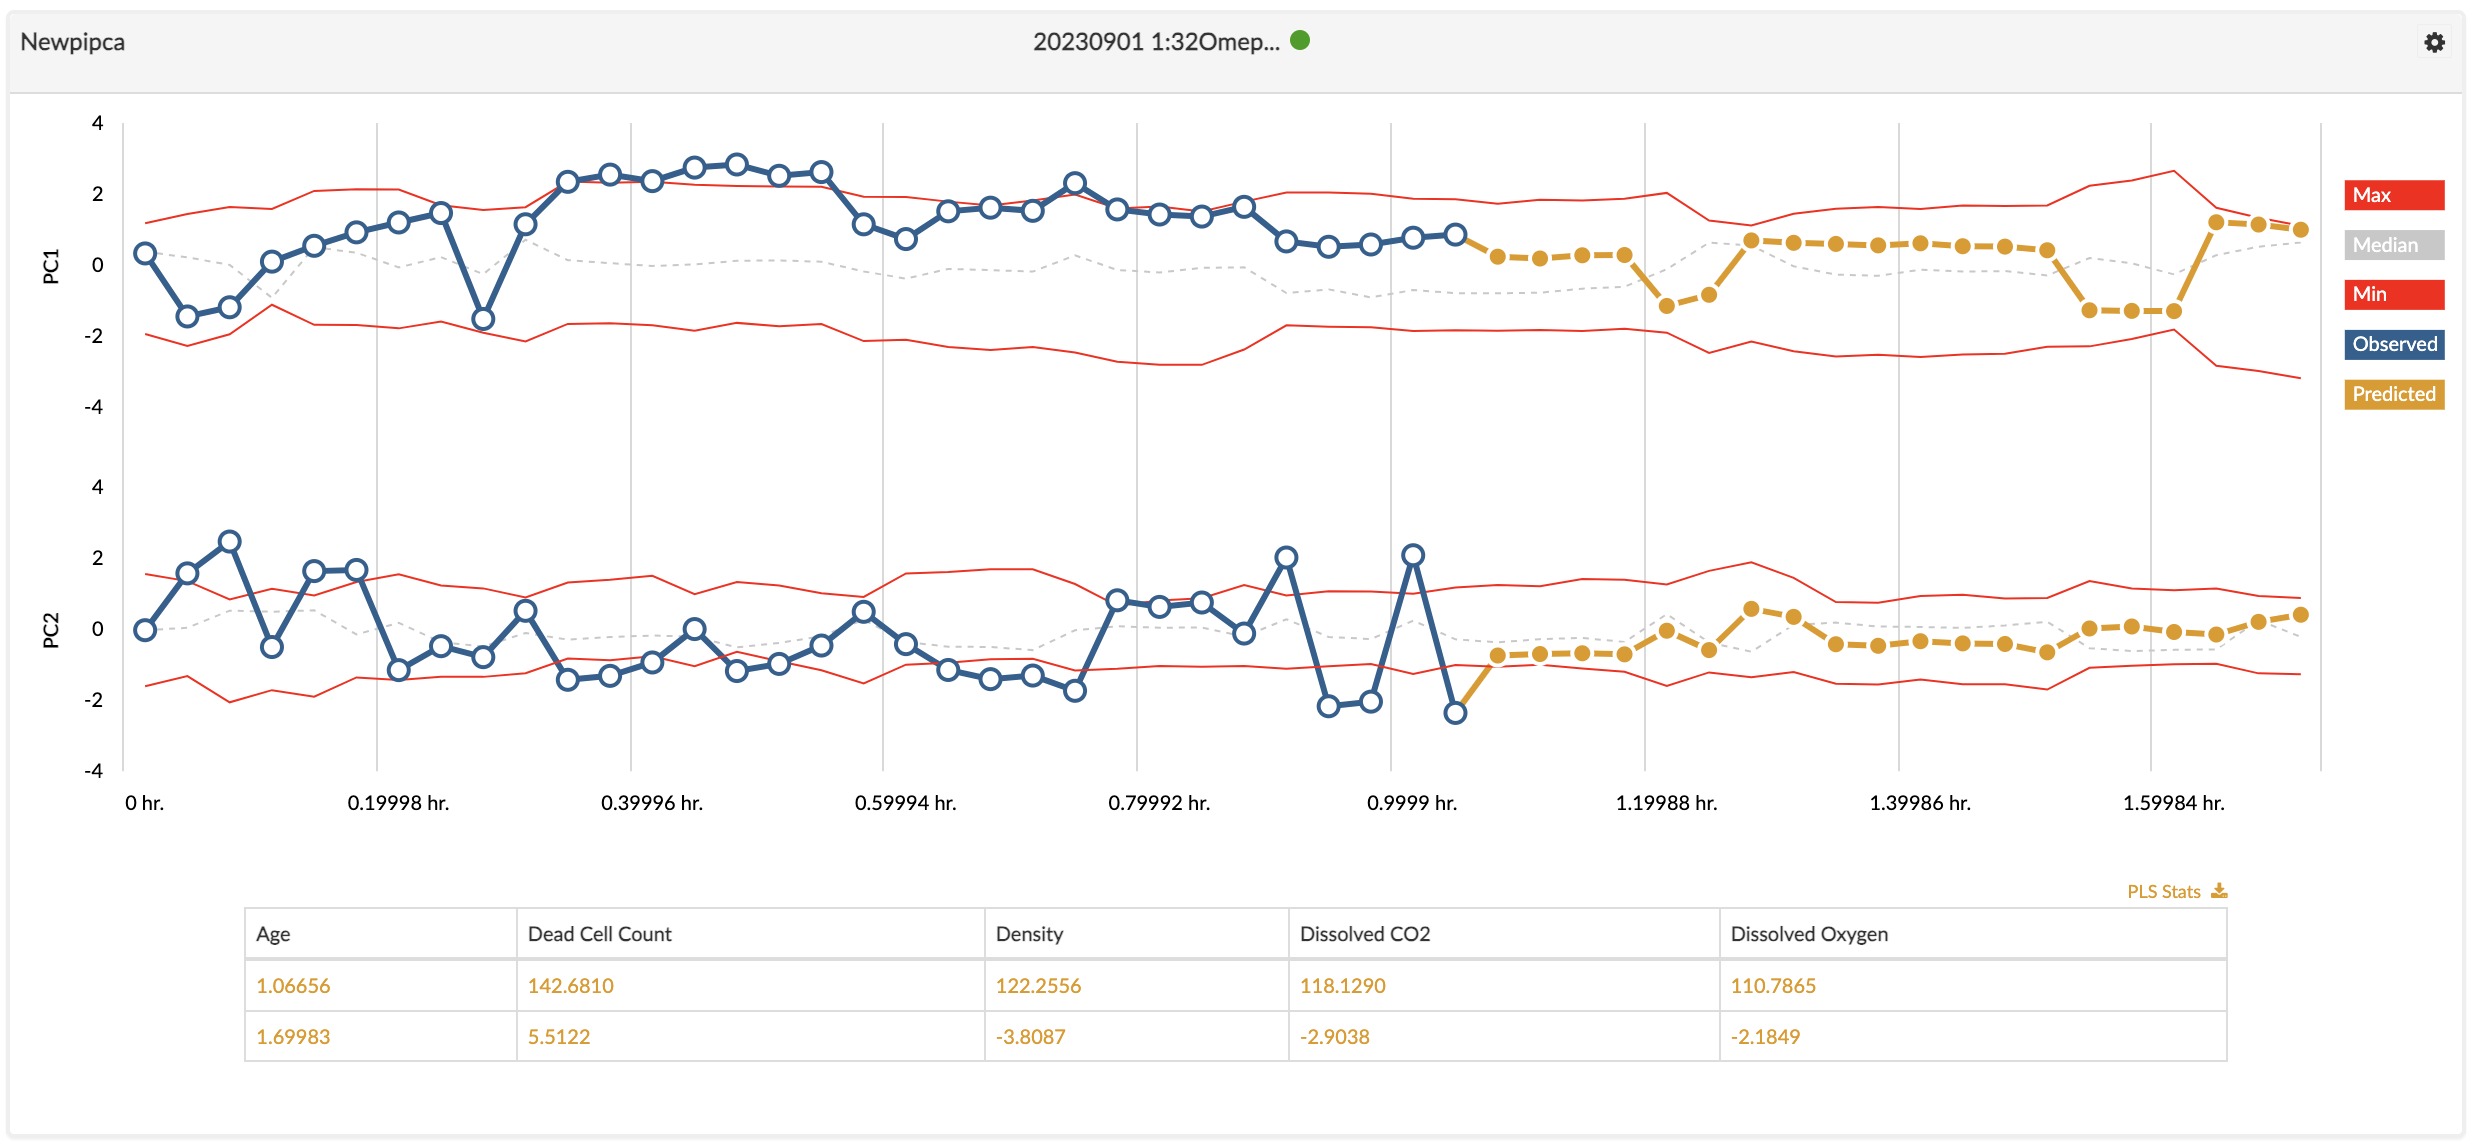
When a unit operation is underway, an intra-stage process monitoring tunnel enables scientists and engineers to understand how the operation’s biological process – such as the growth of cells in a bioreactor or the purification of a protein through chromatography – has progressed and will progress over time. As with an inter-stage process monitoring tunnel, the intra-stage process monitoring tunnel is based on the same core MVDA methods – PCA and PLS regression – to take into account the complex interplay between numerous CPPs and CQAs. For an intra-stage process monitoring tunnel, the principal components are plotted as a function of time, with the upper and lower bounds of the tunnel generated from multivariate data collected during past successful runs of the unit operation.

Figure 4:Intra-stage process monitoring tunnel in Bio4C ProcessPad™ software for a bioreactor. The blue line represents the current running batch’s actual values while the orange illustrates predicted values for the batch. The upper and lower bounds as well as the median line are derived from historical runs, providing a basis for comparison and analysis.
An intra-stage process monitoring tunnel for a bioreactor unit operation, for example, would take into account variables such as the initial cell density, the rate of cell growth, and the rate of protein production; it would also enable teams to drill down into the details to evaluate how much each of these variables was affecting the current and predicted future state of the process. A PCA-based time series model captures how these variables interact with each other over time, while PLS regression can be used to predict how cell density and protein production will change over the course of the process.
Recapping and Looking Ahead
PCA is a technique that can be used to analyze and visualize the relationships between variables in complex data sets, while PLS is a regression technique that can be used to predict future outcomes based on historical data. By combining these two MVDA techniques, it is possible to develop process monitoring tunnels as part of a comprehensive approach to predictive analytics in biomanufacturing that can help monitor and control processes in near real time, predict potential issues, and plan for optimal outcomes.
Incorporating effective MVDA practices into the biomanufacturing can improve the overall efficiency, productivity, and quality of the processes required to produce safe and effective biologic drugs. Not only are the approaches enabled by MVDA aligned with quality by design (QbD) and process analytical technology (PAT) principles that are being widely adopted today, they are also foundational to establishing the connected, continuous biomanufacturing processes that will underpin the cost, agility, sustainability, and quality improvements of tomorrow’s adaptive plants
To continue reading please sign in or create an account.
Don't Have An Account?