Cultrex® 3D Spheroid BME Invasion Assay Protocol
I. Product Description
The 96-Well 3D Spheroid BME Cell Invasion Assay offers a standardized, three dimensional, high content format for quantitating the degree to which invasive cells penetrate a barrier, consisting of basement membrane components, in vitro in response to chemoattractants and/or inhibiting compounds, which is fundamental for angiogenesis1, embryonic development2, immune response3, and tumor cell metastasis4. Basement membranes are continuous sheets of specialized extracellular matrix that form an interface between endothelial, epithelial, muscle, or neuronal cells and their adjacent stroma. They not only support cells and cell layers, but they also play an essential role in tissue organization that influences cell adhesion, migration, proliferation, and differentiation. Basement membranes are degraded and regenerated during development and wound repair, and they are major barriers to invasion by metastatic tumor cells. Current methods for assessing cell invasion through basement membrane barrier most commonly utilize a Boyden chamber approach, such as the Cultrex® BME Cell Invasion Assays. This method does provide a quick, easy, and quantitative approach. However, it is very difficult to visualize invasion microscopically, and the assay starts with a single cell suspension which may negate early steps in the metastatic process, such as the initial epithelial to mesenchymal transition (EMT).
The need for more complete and physiologically predictive cancer invasion models has driven the development of the 96 Well 3D Spheroid BME Cell Invasion Assay. There is growing evidence that tumor cell aggregates or spheroids are more representative of tumors in vivo, and they exhibit several physiological traits including similar morphology, the formation of cell-cell bonds, decreased proliferation rates, increased cell survival, tumor dormancy, and a hypoxic core5-8. Applying this model to a 3D culture invasion assay provides a more physiological approach for assessing tumor invasion and offers a visual component that can be quantitated through image analysis.
The 96 Well 3D Spheroid BME Cell Invasion Assay utilizes 3D Culture Qualified 96 Well Spheroid Formation Plate alongside a specialized Spheroid Formation ECM to drive aggregation and/or spheroid formation of cells. Upon completion of spheroid formation, the spheroid is embedded in an invasion matrix composed of basement membrane proteins. This matrix forms a hydrogel network on which invasive cells can travel. At this point, invasion modulating agents can be applied to the system to evaluate the impact on cell response. Cell invasion is visualized microscopically and can be quantitated through image analysis software.
III. Reagents and Equipment Required but not Provided
- Equipment
- Laminar flow hood or clean room
- 37 °C CO2 incubator
- Low speed swinging bucket 4 °C centrifuge and tubes for cell harvesting
- Hemocytometer or other means to count cells
- –80 °C storage
- Ice bucket
- Standard light microscope (or inverted)
- Pipettes and pipette aid
- Bright Field Microscope with 4X objective and digital camera
- Reagents
- Cell line(s) of interest
- Cell Harvesting Buffer; EDTA, trypsin, or other cell detachment buffer
- Tissue Culture Growth Media
- Pharmacological agents for addition to culture medium, if necessary
- Greiner culture flasks, tissue culture treated, 25 cm2 (Product No. C6231) or 75 cm2 (Product No. C7106)
- Centrifuge tubes
- Serological pipettes
- Gloves
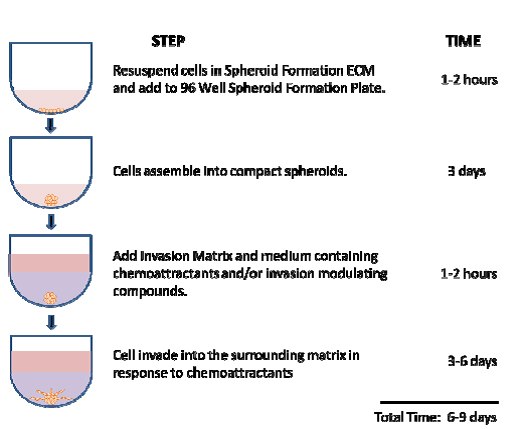
Figure 1.Steps Comprising the 96 Well 3D Spheroid BME Cell Invasion Assay
IV. Precautions and Limitations
- For Research Use Only. Not for use in diagnostic procedures.
- The physical, chemical, and toxicological properties of these products may not yet have been fully investigated; therefore, we recommend the use of gloves, lab coats, and eye protection while using these chemical reagents.
- The CULTREX® 3D Culture 96-Well BME Invasion Assay contains reagents that may be harmful if swallowed, or come in contact with skin or eyes. In case of contact with eyes, rinse immediately with plenty of water and seek medical advice.
V. Preparation Instructions
- 10X Spheroid Formation ECM
10X Spheroid Formation ECM should be thawed on ice at 4 ⁰C and diluted with Tissue Culture Growth Medium chilled to 4 ⁰C; pipet up and down with a serological pipet to mix. Cells are resuspended in 1X Spheroid Formation ECM, and 50 µL of cell suspension is added to each well of the 3D Culture Qualified 96-Well Spheroid Formation Plate.
Table 1 for recommended dilution schedules.
- Invasion Matrix
Invasion Matrix should be thawed on ice at 4 ⁰C, and gently inverted to make a homogenous solution. If there are visible bubbles in the Invasion Matrix, centrifuge 300 x g for 5 minutes at 4 ⁰C in a swinging bucket rotor. Add 50 μL of undiluted Invasion Matrix to each invasion well of a chilled 3D Culture Qualified 96-Well Spheroid Formation Plate.
- Tissue Culture Medium with Invasion Modulating Compounds
Add 2X concentration of Invasion Modulating compounds within the tissue culture medium to compensate for changes in total volume due to the spheroid embedded within the Invasion Matrix. Tissue culture medium must be 37 ⁰C when added to gelled invasion matrix to preserve gel properties.
VI. Storage and Stability
Product is stable for a minimum of 3 months from date of shipment when stored at –20 ⁰C in a manual defrost freezer. For optimal stability, store at –80 ⁰C. Avoid freeze-thaw cycles.
VII. Assay Protocol
These procedures should be performed in a biological hood utilizing aseptic technique to prevent contamination.
A. Cell Harvesting
Culture cells per manufacturer’s recommendation. The following procedure is suggested and may need to be optimized to suit the cell type(s) being studied.
- Cells need to be healthy and proliferating prior to use in the assay. Cells should be passaged 2 or 3 times and evaluated for cell viability by trypan blue or equivalent assay. Do not start the assay until cell viability is greater than 90%.
- Each well requires approximately 2,000 - 5,000 cells, and 25 and 75 cm2 flasks yield at least 1 x 10⁶ and 3 x 10⁶ cells, respectively. Plan accordingly.
- Prior to harvest, visually inspect cells, and record cell health, relative number, and morphology.
- Wash cells two times with sterile PBS or HBSS. Use 5 mL per wash for a 25 cm2 flask and 10 mL per wash for a 75 cm2 flask.
- Harvest cells. For 25 cm2 flask or 75 cm2 flask, add 1 mL or 2 mL, respectively, of Cell Harvesting Buffer (see Materials Required But Not Supplied), and incubate at 37 ⁰C for 5 to 15 minutes until cells have dissociated from bottom of flask.
- Transfer cells to a 15 mL conical tube, and add 5 mL of cell culture medium.
- Centrifuge cells at 200 x g for 3 minutes to pellet cells, remove medium, and resuspend cells in 2 mL of cell culture medium. Cells may need to be gently pipetted up and down with serological pipette to resuspend cells and break up cell aggregates. Visually inspect cells to verify formation of a single cell suspension, no aggregates prior to counting.
- Count cells and evaluate cell viability by trypan blue exclusion or equivalent test. Do not start the assay if cell viability is less than 90%.
- Dilute to 1 x 10⁶ cells per mL in cell culture medium.
B. 96 Well 3D Spheroid BME Cell Invasion Assay
- Assay Preparation – Prior to Day 0
- Establish assay parameters and appropriate controls. Appropriate controls include samples with and without invasion modulating agents, as well as samples with and without Invasion Matrix.
- Determine optimal seeding density for each cell line used. In general, 3,000 cells per well is a good starting point. Optimal seeding density can be evaluated by analyzing the size of spheroid formation using the Spheroid Formation protocol (VII.B.2.).
- Culture cells per manufacturer’s recommendation; adherent cells should be cultured to no greater than 80% confluence.
- Thaw 10X Spheroid Formation ECM on ice overnight in a 4 ⁰C refrigerator.
- Spheroid Formation – Day 0
- Harvest and count cells, as directed in section VII. A.
- Prepare a single cell suspension in 1X Spheroid Formation ECM. See section V.1. for reagent preparation.
- Dispense 50 μL of the single cell suspension in 1X Spheroid Formation ECM per well of the 3D Culture Qualified 96 Well Spheroid Formation Plate. Preserve unused wells for subsequent experiments by applying the strip seals that are included with each plate, if needed.
- Centrifuge at 200 x g for 3 minutes at room temperature in a swinging bucket rotor.
- Incubate at 37 ⁰C in a tissue culture incubator for 72 hours to promote spheroid formation.
- 3D Culture Cell Invasion – Day 3
- Place the 3D Culture Qualified 96 Well Spheroid Formation Plate on ice for 15 minutes to cool wells.
- Working on ice, add 50 μL of Invasion Matrix per well of the 3D Culture Qualified 96 Well Spheroid Formation Plate; see section V.2. for reagent preparation.
- Centrifuge plates at 300 x g at 4 ⁰C for 5 minutes in a swinging bucket rotor to eliminate bubbles and position spheroids within the Invasion Matrix towards the middle of the well.
Caution: centrifugation at high speeds and/or extended periods of time can adversely impact subsequent spheroid invasion. - Transfer plate to a tissue culture incubator set at 37 ⁰C for one hour to promote gel formation of the Invasion Matrix.
- After one hour, add 100 μL of warm (37 ⁰C) cell culture medium containing chemoattractant and invasion modulating compounds, if applicable. See section V.3 for reagent preparation.
- Incubate the plate at 37 ⁰C in a tissue culture incubator for 3 to 6 days, and photograph the spheroid in each well every 24 hours using the 4X objective. Adjust the lighting and focus to provide the most contrast between the 3D structure and background. The use of fluorescence microscopy for cells that express fluorescent protein or have a fluorescent label may also improve contrast and subsequent analysis. Debris may transfer to the bottom of the 96 well plate during handling; wiping the bottom of the wells with lens paper prior to photographing may improve clarity. The assay may be conducted longer than 6 days if desired; the endpoint is usually when the structure size begins to exceed the field of analysis or the cells begin to expire.
- Analyze images using image analysis software to measure changes in the area of the invasive structures to determine the extent of 3D culture BME cell invasion for each sample.
- Image Analysis
Note: Images may be analyzed using free software such as ImageJ (http://rsb.info.nih.gov/ij/); see below. Other image analysis software may be configured to make the same measurements; please consult your software supplier regarding capabilities and instructions.- Photograph image of known size (eg. 1 mm) using 4X objective, and measure pixels in ImageJ.
- Open image. Go to File/Open, and select image.
- Select line tool.
- Draw a line the length of the object.
- Go to Analyze/Measure, and record pixel number.
- Calculate the number of pixels in each mm (eg. 600 pixels/mm). Record result ------- pixels/mm
- Set scale; this will need to be done each time ImageJ is opened.
- Go to Analyze/Set Scale.
- For “Distance in pixels” input value from VII.B.4.v. (above).
- For “Know distance” input “1,000”.
- For “Unit of Length” input “um”.
- Check “Global”, and select “OK”.
- Analyze spheroid image.
- Open image. Go to File/Open, and select image.
- Convert to an 8 bit image: Go to Image/Type/8 bit (check).
- Adjust image threshold. Go to Image/Adjust/Threshold (check). The program will distinguish between dark and light pixels, and the threshold may be adjusted on the histogram using the sliding scale. Similar settings will work for photographs taken under the same conditions. Areas of dark pixels will be overlaid with red. Adjust the threshold so that only the spheroid image is overlaid.
- Select spheroid. Select the circle tool and surround the image. This will eliminate any dark pixels outside of the spheroid from the measure.
- Go to Analyze/Measure. This will measure the area of the spheroid structure (μM2) in a table. Multiple measurements may be made in one table. Save table.
- Convert the table to an Excel worksheet. Open with Excel and “Save As” an .xls or .xlsx file.
- Photograph image of known size (eg. 1 mm) using 4X objective, and measure pixels in ImageJ.

Figure 2.Process for Analysis of 3D Invasion A) Capture image and convert to 8 bit; B) Set threshold to capture the total structure; C) Select structure to calculate total area.
VIII. Data Interpretation
1. The Cultrex® 3D Culture 96-Well BME Invasion Assay provides morphological and quantitative analysis of cell invasion. Invading cells project out of the spheroid into the surrounding matrix as spindle-like projections; whereas, there are no projections in the absence of an invasion matrix (figure 3). This results in large changes in surface area that occur in a relatively small amount of time for invasive cell lines which do not occur for non-invasive cell lines (figure 4). These changes in surface area can be measured and used to compare relative invasiveness of different cell lines or cell lines subjected to genetic manipulation.

Figure 3.Morphology of 3D Cell Invasion Over a Four Day Period. Non-invasive cells (MCF-7) remain as cell agregates and do not invade into the surrounding invasion matrix; wheras, invasive cells (MDA-MB-231) invade into the surrounding invasion matrix as spindle-like protrusions.
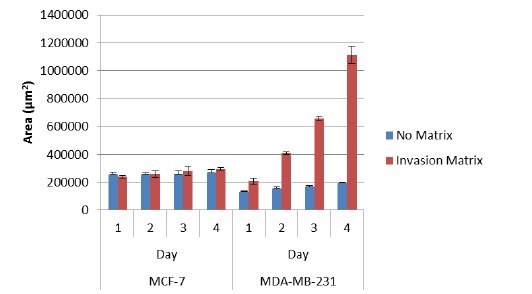
Figure 4.Quantitative Analysis of Surface Area for Non-invasive (MCF-7) and Invasive (MDA-MB-231) Cell Lines Over a Four Day Period.
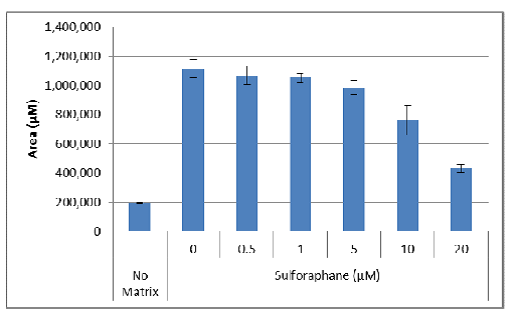
2. The changes in area can also be used to evaluate the effect of pharmacological compounds on 3D cell invasion. Once optimal assay conditions have been established, this can be evaluated as an endpoint assay. The following assay was conducted using MDA-MB-231 cells treated with varying concentrations of the inhibitor Sulforaphane.
a. First the areas were calculated for each condition, and these values were used to generate average and standard deviations:
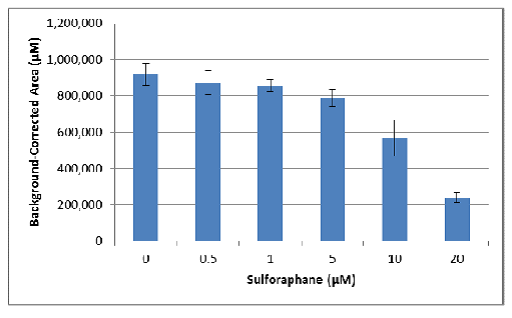
b. Next the area for the spheroid with no Invasion Matrix was used as a background value and subtracted from the average of each condition:
c. Finally, the resulting areas were divided by the area obtained for the no inhibitor control, providing the invasion index as a percentage of control:
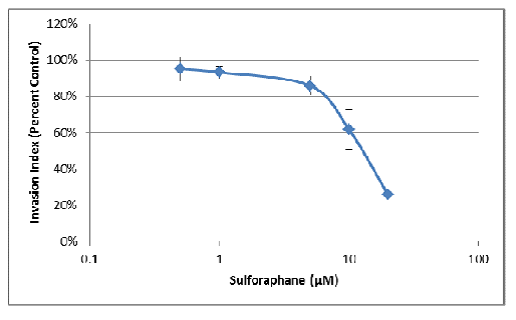
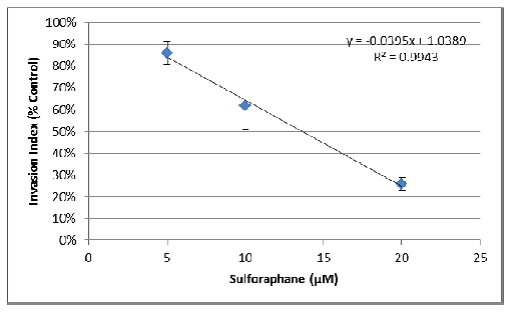
d. Using the linear portion of the inhibition curve, the IC50 may be calculated by determining x where y = 0.5:
-Based on the line equation, x = (y – 1.0389) / -0.0395.
-Thus IC50 = (0.5 – 1.0389) / -0.0395 = 13.6 μM Sulforaphane
Materials
To continue reading please sign in or create an account.
Don't Have An Account?