RNA Isolation from Blood, Cultured Cells, and Animal or Plant Tissue on Whatman™ FTA™ Cards
Whatman FTA cards are used for biological sample collection, storage, transport, and isolation of high-quality DNA for downstream applications. In the following studies, FTA cards were evaluated for their ability to collect, store, and isolate high-quality RNA from a variety of crude biological samples. illustra™ RNAspin Mini RNA Isolation Kit was used to purify RNA after sample collection and storage.
This report demonstrates that Whatman FTA cards can be used to immobilize and store crude samples of whole blood, cultured cells, animal tissue, or plant tissue for at least 48 h (blood or cultured cells), 8 wk, or 5 d, respectively, without loss or damage to the cellular RNA. illustra RNAspin Mini RNA Isolation Kit can then be used to purify the RNA for consistent, high-quality expression profiling.
Summary introduction for all studies
With recent advances in high-throughput analysis, gene expression studies have become a valuable tool both in basic research and in the clinic. As the genomics era has evolved into fields such as “transcriptomics” (also known as “expression profiling”), RNA stabilization and extraction have become increasingly important. However, RNA is far more labile than DNA, and has been notoriously difficult to purify and store due to rapid degradation by ubiquitous ribonuclease enzymes.
In addition, relative levels of RNA within a particular cell type can change rapidly with changes to cellular metabolism.
Thus, in order to allow transport of samples and purification of intact RNA, RNases must be inactivated, and cellular metabolism completely halted. Previously, this has required flash freezing in liquid nitrogen or treatment with chemicals that can interfere with assays. The following studies demonstrate that Whatman FTA cards provide an alternative that allows for room temperature collection and storage of biological samples and subsequent isolation of high-quality RNA.
Introduction for blood and cultured cell studies
Gene expression data are useful for research on disease detection, prognosis, and treatment. For example, altered gene expression in blood samples, measured via specific changes in relative RNA levels, can provide insight into the presence or progression of disorders, such as some cancers.
In addition, gene expression analysis in cultured cells can be used to understand how diseases develop and whether potential therapeutic agents are effective in vitro. As with other samples, accurate expression analysis of blood and cultured cells relies on rapid sample collection and RNA stabilization.
Materials and methods for blood and cultured cell studies
Sample collection
Whole blood
Human blood was collected by venipuncture into an EDTA vacutainer. As soon as possible after collection, 40 µL aliquots of blood were applied to FTA cards, which were then dried for a minimum of 2 h at room temperature.
Cultured cells
THP-1 human acute monocytic leukemia cells were grown in RPMI-1640 media with 10% FBS. At collection, 1 mL of cells was harvested, pelleted by centrifugation (400 rpm for 5 min), and resuspended in 200 µL of medium before spotting 40 µL aliquots onto FTA cards and drying for a minimum of 2 h at room temperature.
Control RNA
As a processing control, 5 µL of 50 ng/µL Control Total RNA (human; Applied Biosystems, Foster City, CA, USA) was spotted onto four pre-punched 5.0 mm diameter FTA discs.
RNA purification
illustra RNAspin Mini RNA Isolation Kit from Cytiva was used to isolate total RNA from blood, cultured cells, and purified RNA collected on FTA cards as described above. A Harris Uni-Core disposable 5.0 mm punch was used to remove discs from the center of each dried sample spot. The manufacturer’s standard protocol for RNA isolation was followed. Briefly, each disc was homogenized in extraction buffer supplemented with β-mercaptoethanol using a 20-gauge needle. The extract was then applied to an RNAspin Mini Filter unit. After centrifugation and addition of 70% ethanol, the lysate was applied to an RNAspin Mini column and centrifuged for 1 min. The silica membrane was desalted, treated with DNase I, and washed, and total RNA was eluted in 40 µL of RNase-free water after 1 min centrifugation.
RNA quantitation
The concentration of eluted RNA was determined using quantitative reverse-transcriptase PCR (RT-qPCR) in an ABI™ 7900HT thermal cycler (Applied Biosystems). Reactions were set up using TaqMan™ EZ-RT PCR Kit (Applied Biosystems) with GAPDH Control Reagents (human; Applied Biosystems). Standard curves for RNA quantitation were prepared using control RNA supplied with the kit and a five-point serial dilution from 5 ng/µL to 0.0005 ng/µL. PCR primers for RNA analysis were designed across introns to ensure that only cDNA was amplifiable.
Reverse transcription and cDNA analysis
After quantitation, equal amounts of RNA were transcribed into cDNA using SuperScript™ III First-Strand Synthesis System for RT-PCR (Invitrogen, Carlsbad, CA, USA). Reactions (50 µL) were prepared in duplicate to increase the final amount of cDNA for analysis. Following reverse transcription, duplicate samples were pooled and assayed by quantitative PCR (qPCR) using TaqMan Universal PCR Master Mix (Applied Biosystems) and RNase P Control Reagents Kit (Applied Biosystems).
Quantitation of cDNA at this point ensured that equal amounts of cDNA from different samples were used for subsequent qPCR in StellARray™ Gene Expression System trays (manufactured for Lonza Walkersville (Walkersville, MD, USA) by Bar Harbor Biotechnology. Standard curves for cDNA quantitation were prepared using control DNA supplied with the RNase P kit and a five-point serial dilution from 200 ng/µL to 0.02 ng/µL.
Expression analysis
Custom-made 384-well expression plates were purchased from Lonza Walkersville; each plate contained lyophilized primers for 96 genes in four replicate quadrants. cDNA was added to the plates as described below and was amplified using a 7900HT thermal cycler prior to analysis with the global recognition pattern software provided by Lonza.
- TaqMan master mix (1056 µL) was diluted with 998 µl of distilled water.
- Diluted TaqMan master mix (2006 µL) was added to 106 µL of cDNA.
- Aliquots (20 µL) were added to each of the 96 wells containing predetermined primer sets. Plates were incubated for 30 min at room temperature.
- Following incubation, plates were run on a 7900HT thermal cycler using the thermal profile provided by Lonza.
- Analysis was completed first using global recognition pattern software to determine fold changes, and second by plotting raw Cq values* for each gene against replicate measurements from separate RNA isolations.
*Cq value = quantification cycle; the PCR cycle at which the fluorescence in an individual reaction exceeds a set threshold. Low Cq values therefore reflect large quantities of starting template (high level of gene expression), while high Cq values reflect the opposite.
Results and discussion for blood and cultured cell studies
By comparing the RNA expression levels of 96 target genes, it was possible to assess the reproducibility of expression profiles between replicate extractions for each sample type. Figure 1 shows representative data using (a) blood, (b) purified control RNA, and (c) THP-1 cells. Each graph represents a comparison of two of the four StellARray plates used for that extraction method.
The typical dynamic range of qPCR is between 15 and 35 cycles. At template quantities small enough that Cq values exceed 35, data variability typically increases. This often leads to a lack of detectable amplification (recorded as a Cq of 40), which was observed for some samples in this study (Figure 1).
Although the graphs in Figure 1 represent data from two quadrants per sample type, similarly reproducible expression levels were obtained from all four replicate RNA extractions from each sample type run on separate plates (data not shown). In addition, FTA cards did not alter or bias the expression profiles of RNA isolated directly from THP-1 cells compared to RNA isolated from cells applied to FTA cards (data not shown)
The fact that parallel extractions from the same sample type (i.e., whole blood or cell culture) produced a linear correlation when their RNA expression levels were compared (Figure 1) demonstrates the consistency of FTA and illustra RNAspin Mini RNA Isolation Kit for immobilization, storage, and purification of high-quality RNA. This level of quality and reproducibility is key in any gene expression study.
In a previous study, FTA cards were shown to stabilize RNA from whole human blood for 48 h with no degradation, which would facilitate remote sample collection and transport to a laboratory for extraction and expression analysis (data not shown).

Figure 1.Cq values of replicate RNA extractions from FTA Cards onto which (A) blood, (B) purified RNA, and (C) THP-1 cells had been applied. For each total RNA sample, 96 target sequences were amplified using StellARray gene expression plates. Plots represent Cq values for the 96 target sequences from parallel RNA extractions run on duplicate plates.
Conclusions for blood and cultured cell studies
In conclusion, these results demonstrate that whole blood samples, cultured cells, and purified RNA can be spotted onto FTA cards and stored for up to 48 h before isolating RNA using Illustra RNAspin Mini RNA Isolation Kit. The resultant RNA is sufficient in yield and quality for reproducible high- throughput expression analysis using PCR arrays.
Introduction for animal tissue studies
Cells in culture do not always behave as they do in whole tissues. In the laboratory, in vitro analysis of gene expression not only in cultured cells but also in whole tissues is yielding new understanding of the molecular basis of many diseases, as well as providing a quantitative measure of the effects of potential new drug therapies. This study demonstrates that tissue samples can be pressed directly onto FTA cards for transport and storage for at least 2 months, without homogenization or other processing, and without significant loss of cellular RNA. illustra RNAspin Mini RNA Isolation Kit can then be used to purify RNA from these tissue samples for consistent, high-quality expression profiling.
Materials and methods for animal tissue studies
Sample collection
c57BL/6 mice were euthanized and dissected to collect the heart, brain, lung, liver, and kidney. Each organ was snipped into 2 to 3 mm pieces. Fresh tissue was applied directly to FTA cards, homogenized prior to application, or processed immediately to isolate RNA (see below). For direct application, a 2 to 3 mm snippet of tissue was placed on a card, then rubbed with a clean nuclease-free 1.5 mL tube. Homogenized tissue was prepared by transferring snippets of tissue to a 1.5 mL tube with 500 µL of PBS and homogenizing by hand using a disposable plastic dounce homogenizer. Homogenate was then applied to FTA cards (40 µL per application area). FTA cards containing tissue samples were air-dried for at least 3 h. Cards were stored at room temperature for 2 months in a sealed pouch with desiccant. Punches (3.0 mm) were taken from the center of a dried sample spot then placed in clean RNase-free 1.5 mL microcentrifuge tubes.
RNA purification
Total RNA was purified using illustra RNAspin Mini RNA Isolation Kit from Cytiva. The manufacturer’s protocol was followed. Briefly, each disc was homogenized in extraction buffer supplemented with β-mercaptoethanol using a 20-gauge needle, then applied to an RNAspin Mini Filter unit. After centrifugation and addition of 70% ethanol, the lysate was applied to an RNAspin Mini column and centrifuged for 1 min. The silica membrane was desalted, treated with DNase I, and washed, and total RNA was eluted in RNase-free water after 1 min centrifugation.
Expression analysis
Relative expression levels compared to GAPDH housekeeping gene were determined using primers for tissue-specific gene expression (Applied Biosystems; Table 1).
Results and discussion for animal tissue studies
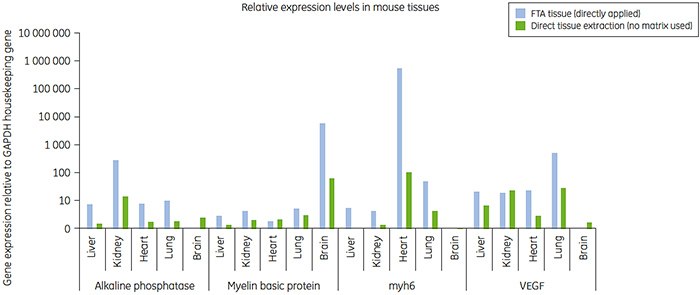
To analyze the mRNA content in the stored tissue samples, relative expression levels were determined with real-time tissue-specific probes (Table 1). Samples applied directly to FTA cards or as crude homogenates were analyzed. The data for crude homogenates (not shown) were similar to the data shown for tissues that were directly applied to the cards (1). The GAPDH transcript was used to equilibrate mRNA levels between samples. Results in Figure 2 show elevated mRNA levels of: alkaline phosphatase in kidney tissue; myelin basic protein in brain tissue; Myh6 in heart and lung; and VEGF in lung. These data agree with predicted expression patterns of RNA from these tissues and with results obtained when RNA is isolated directly from these tissue types (2–5).
Conclusions for animal tissue studies
These results demonstrate that FTA cards can be used to safely transport and archive whole tissue samples, while maintaining cellular RNA. Samples can be stored on FTA cards for at least 2 months prior to RNA isolation and expression analysis. Because there is no need for refrigeration or liquid reagents, sample collection in the field is greatly simplified, as are sample handling and preparation.
(Note: Although the predicted gene expression profiles for gene targets in this report were supported by published literature, other RNA species of differing expression levels and stability may not be protected by the FTA card to a similar extent. Ongoing experimentation is underway to investigate the stability of all species of RNA on FTA matrices.)

Figure 2.Relative gene expression compared to GAPDH for RNA isolated from different tissues collected on FTA cards (blue). As a control, RNA was isolated directly from each tissue (no matrix used; green). For all samples, RNA was purified using illustra RNAspin Mini RNA Isolation Kit. Note that the Y axis shows a logarithmic scale.
Introduction for plant studies
Extraction of nucleic acids from plant materials presents significant difficulties, including the requirement for physical disruption of cell walls and for an array of secondary reagents, many of which are highly damaging to nucleic acids or inhibitory to downstream analytical applications. Typically, plant tissues are disrupted by grinding in liquid nitrogen before RNA can be purified from other cellular components. The need for freezing with liquid nitrogen immediately post- harvest to preserve RNA has hampered many studies, particularly those in which the tissue collection site is outdoors or away from the laboratory.
This study demonstrates the utility of FTA cards in two very different plant gene-expression studies:
The first system studied was a knockout mutant (SALK_035009) of the Arabidopsis protein phosphatase PP2A C4 subunit (At3g58500).
The second system studied was the Arabidopsis DR5::GUS promoter-reporter fusion (6) mutant. GUS (β-glucuronidase) is a reporter gene that turns plant tissues blue under certain conditions, in this case when auxin induces its expression.
Expression analysis
Following extraction and DNase treatment, RNA was quantitated by RT-qPCR using a 7900HT Real Time PCR system (Applied Biosystems) and a TaqMan RNA to Ct kit (Applied Biosystems). The absence of genomic DNA contamination in RNA was confirmed using Power SYBR™ Green Master Mix (Applied Biosystems) with the TIP41-like primers (see below).
Primers were designed using Primer Express (Applied Biosystems) and purchased from Integrated DNA Technologies for the following genes:
- TIP41-like (At4g34270): normalization gene shown to express at very constant levels in Arabidopsis, regardless of plant tissue, age, or stimulus (7).
- PP2A C4 (At3g58500): protein phosphatase targeted in knockout plants (amplicon located on 3’ side of insert).
- GUS (NC_010498): E. coli β-glucuronidase used in DR5::GUS promoter-reporter fusion plants.
Cq values obtained by RT-qPCR were used to calculate expression for genes of interest (PP2A or GUS) relative to the normalization gene (TIP41-like) using the ΔΔCq method (8).
Histochemical staining
At the same time that DR5::GUS seedlings were harvested for expression analysis, at least 10 each of control and induced seedlings were stained using the protocol of Martin et al. (9). Briefly, this involved infiltration of an X-Gluc based substrate into seedlings using a vacuum. Seedlings were then incubated in the substrate solution at 37°C without vacuum for 4 h before microscopic examination
Results and discussion for plant studies
Minor protocol modifications
When using the pairing of FTA cards and illustra RNAspin Mini RNA Isolation Kit for gene expression studies in plants, minor protocol differences are necessary. These include first the use of a tool to pound the plant material onto the card, a step necessitated by the presence of cell walls that must be mechanically ruptured. The second difference between plant and animal protocols is that a post-extraction.
DNase treatment of RNA was found to be necessary when extracting RNA from plant samples.
PP2A C4 expression analysis in knockout plants
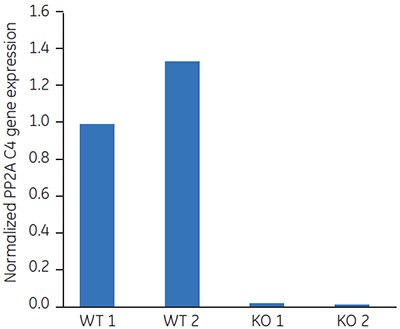
Transcripts of both TIP41-like and PP2A C4 were amplified in all RNA samples as determined by RT-qPCR. Expression levels of PP2A C4 were normalized to those of TIP41-like in order to compensate for differences between samples in amount of total RNA used. Figure 3 shows normalized PP2A C4 expression in two wild type (WT) and two knockout (KO) samples.

Figure 3.Expression of the protein phosphatase PP2A (SALK_035009) in two wild type and two knockout Arabidopsis plants. Youngest fully expanded leaves from 5-wk-old plants were applied to FTA cards; RNA was eluted and quantitated as described above. Expression of PP2A C4 was normalized to that of TIP41-like.
GUS expression analysis in seedlings
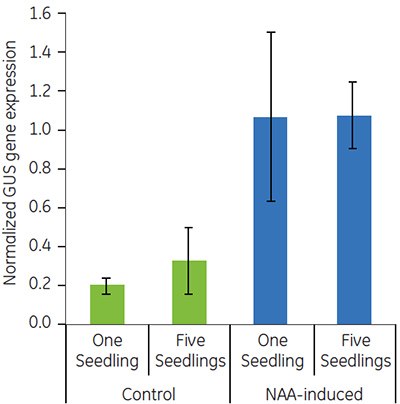
Transcripts of both TIP41-like and GUS were amplified in all RNA samples using RT-qPCR. GUS transcript levels were normalized to those of TIP41-like as above. GUS gene expression in the DR5::GUS control and induced Arabidopsis populations is shown in Figure 4.
Figure 4 shows that samples consisting of as few as a single seedling yielded sufficient RNA for RT-qPCR. Comparison of relative gene expression levels measured from single seedlings with those of five seedlings pooled showed that the amount of tissue (number of seedlings used) did not noticeably affect the relative gene expression (Figure 4).
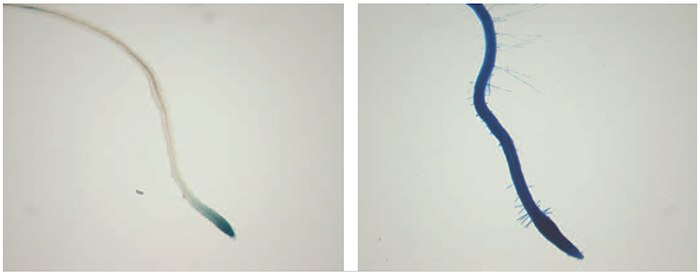
The increased GUS gene expression levels observed in the 1-naphthaleneacetic acid (NAA)-induced DR5::GUS seedlings compared to controls reflect those observed in previous work (6) and were also corroborated by histochemical staining (Figure 5).

Figure 4.Expression of GUS in DR5::GUS control and NAA-induced populations. For each bar, n=3; error bars represent standard deviations. Seedlings were applied to FTA cards, and RNA was eluted and quantitated as described above. Expression of GUS was normalized to that of TIP41-like.

Figure 5.Histochemical staining of roots from control (left) and NAA-induced (right) DR5::GUS seedlings. Blue staining reflects expression of GUS gene in response to the presence of auxin. Note: endogenous auxin is sufficient to cause GUS expression in root tips when no exogenous supply of auxin is present.
Conclusions for plant studies
FTA cards are capable of capturing and storing RNA for downstream expression profiling from whole plant tissues. Following collection and storage of leaves and seedlings on FTA cards and RNA purification with illustra RNAspin Mini RNA Isolation Kit, clear differences in specific mRNA levels were observed between wild-type and knockout mutants. In addition, a second set of experiments based upon the use of a reporter gene construct verified that specific mRNA levels increased when plants were exposed to a chemical inducer.
Summary conclusions for all studies
In summary, the combination of FTA cards and illustra RNAspin Mini RNA Isolation Kit allows for the collection, storage, and isolation of high-quality RNA from many types of crude biological samples. These sample types include whole human blood, cultured cells, animal tissue, and plant leaves and seedlings. Samples can be stored at room temperature for at least 48 h prior to RNA isolation. Extracted RNA is of sufficient yield and quality for reproducible expression profiling. The room temperature sample collection, storage, and transport of RNA adds to the utility of FTA cards for out of laboratory sample collection.
References
Materials
To continue reading please sign in or create an account.
Don't Have An Account?