Cell Retention Technology and Specialized Cell Culture Media for Intensified Upstream Processing
For cells to efficiently produce the target protein in a conventional fed-batch cell culture process, nutrients and/or other feed components must be periodically added to the bioreactor. In perfusion mode, a cell retention device is used to maintain cells inside the bioreactor while components such as spent media, cell debris, and protein products are continuously removed and replaced with fresh media. Perfusion cultures can achieve higher cell density, run for a longer duration, reduce turnover time, and improve overall product yield and quality within a facility, making this approach a key enabler of upstream process intensification.
Many cell retention technologies utilize membrane filtration to achieve the separation of spent media, cell debris, and the protein product; these devices, however, can have mechanical or performance challenges related to throughput, efficiency, product retention, and process scalability. Therefore, it is important to select an optimized cell retention technology to fit the application.
Section Overview
Intensified Upstream Case Study Design
This study demonstrates the use of a Cellicon® filter and controller in an N-1 perfusion process with Cellvento® 4CHO-X expansion medium (Figure 1) as compared to a control seed train using shake flasks (Figure 2). The cells from each condition were used to seed a fed-batch production bioreactor from which cell growth, titer, nutrients, metabolites, and product quality were assessed. Additionally, a high seeding density was evaluated using cells from the perfused N-1 step. Results indicated that cell growth, specific productivity, and product quality were similar for all three processes, confirming that use of the Cellicon® filter can be used to intensify the upstream process while maintaining productivity and product quality.
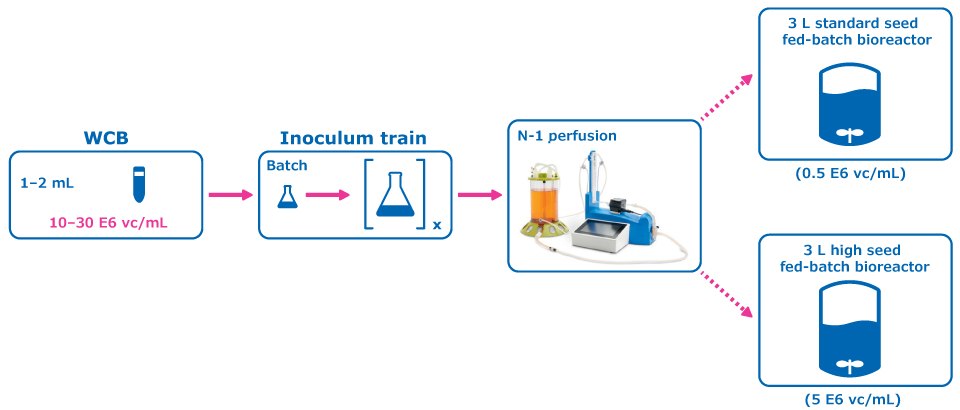
Figure 1.Experimental Condition: Perfused N-1 Seed Train.

Figure 2.Control Condition: Conventional Seed Train.
Perfused N-1 and Conventional Seed Trains
A perfused N-1 seed train utilizing a Cellicon® filter for cell retention (Figure 1) was compared to a conventional seed train in shake flasks prior to inoculation of a set of fed-batch bioreactors at 0.5E6 cells/mL. The perfused N-1 step targeted a cell density of >50 E6 cells/mL prior to transfer of cells to the production bioreactors and was used to inoculate a set of production bioreactors at a higher seed density of 5E6 cells/mL in addition to the standard seed density of 0.5E6 cells/mL.
For the control condition, cells were frozen in EX-CELL® CD CHO Fusion medium and passaged in flasks inside an incubator at 6% CO2 and 125 RPM, and then inoculated at 0.5 E6 vc/mL to the production fed-batch experiment. In the experimental condition, cells from the working cell bank of Cellvento® 4CHO-X Expansion medium were thawed and expanded in flasks prior to inoculation of a perfused N-1 bioreactor. A 100 cm² Cellicon® filter with a flow rate of 100 mL/min was used for cell retention, attached in the configuration shown in Figure 3. This step took place in a 3 L Mobius® bioreactor with a working volume of 2.2 L and was controlled according to the parameters listed in Table 1. The CSPR was maintained at 40 pL/cell/day until the cells reached a density of >50 E6 vc/mL, at which point the cells were transferred to inoculate the production bioreactors.
Figure 3.Cellicon® filter connected to 3L Mobius® bioreactor.
Fed-Batch Production Process
The fed-batch production processes were run in 3 L Mobius® bioreactors with a starting volume of 1.5 L and followed the control parameters outlined in Table 2 and the feed strategy outlined in Table 3. Feed percentages were based on the volume at the time of feeding, with a 50:50 ratio of EX-CELL® Advanced Feed 1 and Cellvento® 4Feed. The low-seed strategy started at 0.5 E6 cells/mL and followed the historical feed schedule, and the high-seed strategy started at 5 E6 cells/mL and followed a shifted feed schedule based on the same strategy as the historical process. Glucose was maintained at 6 g/L with daily additions; it was increased to 12 g/L on day 5 and 10 g/L on day 12 so that the following day’s addition could be skipped.
Each bioreactor run was performed in duplicate with samples taken once a day to evaluate VCD, viability, nutrients, and metabolites. Additionally, HPLC was used to measure titer on days 7 and 9–14; samples from day 14 were submitted for product quality analysis.
Intensified Upstream Case Study Results
Perfused N-1 Seed Train Bioreactor
The perfused N-1 bioreactor was inoculated with cells from the prepared cell bank at 0.68 E6 cells/mL. Perfusion was started on day 3 and the cells grew exponentially up to 52.7 E6 vc/mL and maintained a high viability before being added to the production bioreactors on day 6 (Figure 4).
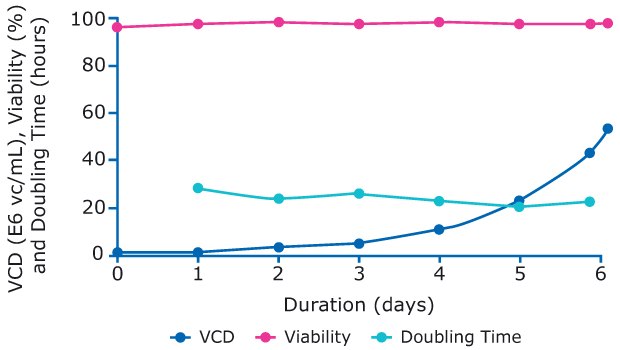
Figure 4.Viability, viable cell density, and doubling time of cells in N-1 perfusion process.
Fed-Batch Production Process with Standard- and High-Seeding Density
VCD and Viability
Viable cell densities of each production bioreactor for the 14-day run were measured. The peak VCD was achieved 3 days earlier for the high-seed process and was slightly higher than for the lower-seeded bioreactors – 30 E6 vc/mL versus 25 E6 vc/mL (Figure 5). Declines in VCD after the peak followed a similar trend under all conditions and were within normal process variability. The high-seed process began to experience a drop in viability 3 days earlier than the control (Figure 6), resulting in a final viability lower than the control.
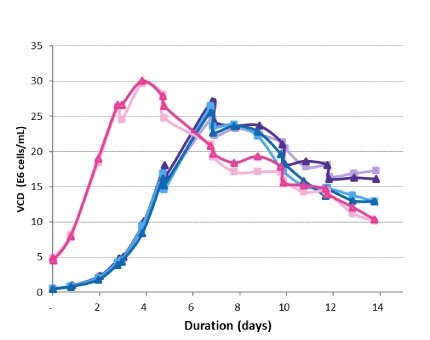
Figure 5.Viable cell density trends in the production bioreactors.
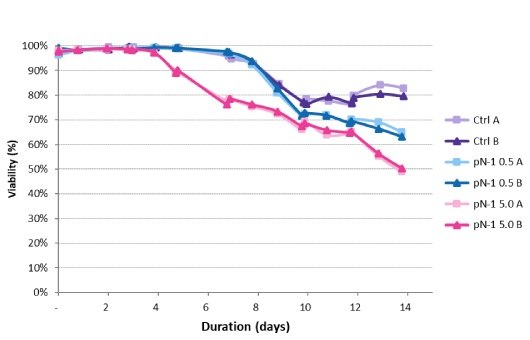
Figure 6.Viability trends in the production bioreactors.
Titer and Specific Productivity
Titer was measured for each bioreactor on day 7 and days 9–14 (Figure 7). The high-seed condition provided an increase in protein production over the run, with a final concentration of just over 5 g/L. There was no difference between the final protein concentrations for the conditions with a standard seeding density, regardless of the inclusion of a perfused N-1 seed train step. The specific productivities were very similar across conditions, at approximately 20 pg/cell/day for each sample (Figure 8). The higher titer in the high-seed condition was a result of the overall increased viable cell count rather than a difference in specific productivity.
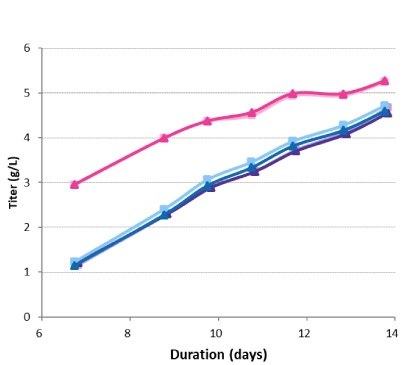
Figure 7.Titer in the production bioreactors.

Figure 8.Specific productivity in the production bioreactors.
Nutrient and Metabolite Concentrations*
- The glutamine and glutamate concentrations were similar regardless of bioreactor conditions. They were influenced by the time of the feeds, with an increase in both glutamine and glutamate observed just after a feed.
- The glucose concentration over the course of the run also followed a similar pattern for each condition. Early in the run, between days 0 and 5, the high-seed condition had a higher rate of glucose consumption due to the higher cell density. However, this consumption rate decreased later in the process as the viability dropped.
- Ammonia generally showed an increase in concentration over the course of the run, prior to a drop on the last few days. The perfused N-1 high-seed condition reached its peak two days earlier than the standard seed conditions.
- The lactate trend correlated with the VCD trends in that there was a shift from production to consumption when the maximum cell density is reached. At the end of the run, a shift back to production of lactate was observed. Carbon dioxide was used for pH control and correlated with the lactate trend. As the lactate increased, the pH dropped, and CO2 is not needed. Then, as lactate is consumed, the pH increases, and CO2 is required to maintain the pH setpoint.
Overall, the trends in lactate and CO2 correlated to the phase of cell growth and were not significantly affected by the experimental conditions.
Analysis of Product Quality
Samples for product quality were taken on the final day of the fed-batch processes. Size exclusion chromatography (SEC) analysis showed consistent size variants across all conditions, detecting almost all the product as a monomer. A small amount of fragment appeared in one of the high seed perfused N-1 samples, but it was not observed in duplicate. Charge analysis showed relatively consistent charge profiles between conditions. Slightly higher acidic peaks were observed in the high seed perfused N-1 cultures, and this resulted in slightly lower neutral and basic peaks. This trend was most likely correlated with the lower pH towards the end of the culture, which could be mitigated with process development. A glycan analysis was performed on the samples from each condition to look for any changes to the target molecule. As shown in Figure 11, the glycan profile was very consistent between the perfused N-1, high-seed perfused N-1, and control conditions. Overall, the product quality was not affected by adding a perfused N-1 bioreactor in the seed train or using a high seeding density. The use of a Cellicon® filter and Cellvento® 4CHO-X Expansion medium also did not significantly affect the product quality during the production runs.
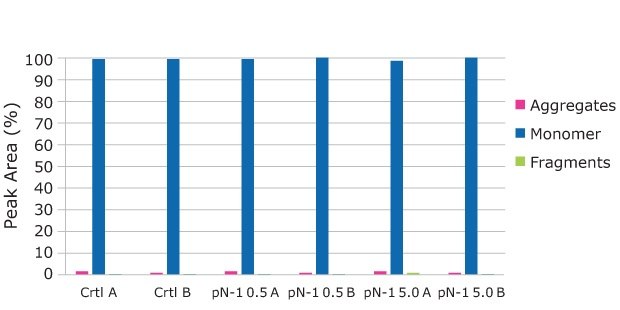
FIgure 9.The SEC Analysis shows consistent aggregate profile across all conditions, detecting almost all of the product as a monomer
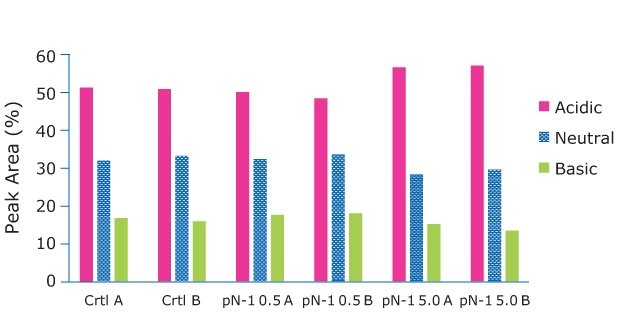
Figure 10.The Charge Analysis shows charge profiles observed were relatively consistent between conditions
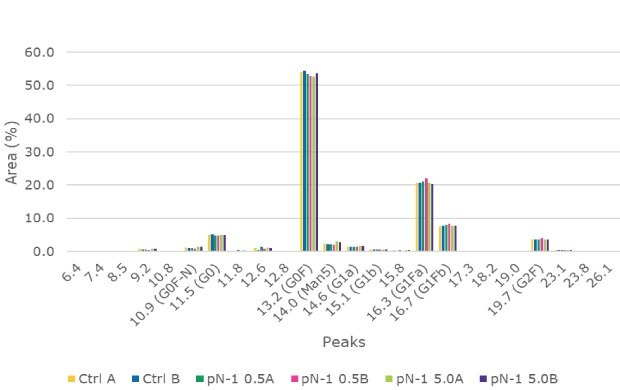
Figure 11.The Glycan Analysis shows the glycan profile came back as very consistent between the perfused N-1, high-seed perfused N-1, and control conditions.
Intensified Upstream Case Study Discussion
This case study demonstrated the use of a Cellicon® filter and controller and Cellvento® 4CHO-X Expansion medium in a seed train based on the results of a fed-batch production bioreactor. The use of the Cellicon® cell retention solution enabled a 10x greater cell density in the N-1 step that could reduce process steps or facility footprint – both key components of process intensification.
Results of the fed-batch production bioreactor were used to evaluate the effect of the Cellicon® filter and controller on the overall process. When comparing the production bioreactors seeded at 0.5 E6 vc/mL, in which one process included the N-1 perfusion step, and one used only shake flasks for cell expansion, there were no significant differences in cell density, viability, titer, specific productivity, nutrient/metabolite concentrations, and product quality. This demonstrates that the use of the Cellicon® filter does not modify process output and drug quality attributes and is a viable solution for process intensification.
When comparing the high-seed bioreactors to both standard seed bioreactors, some process differences were observed. The high seed bioreactors achieved a greater peak viable cell density and integral viable cell count. This led to an increased titer since the specific productivity was in the same range as the control conditions. An increased titer was highly beneficial since greater productivity was achieved within the same time. There were no significant differences in the nutrient/metabolite concentrations or the product quality between the high-seed bioreactors or the standard seed bioreactors. For this specific process, additional development work could be completed, including adjusting the feed schedule or implementing a temperature shift to solve the viability drop mid-run and to further improve the results. Overall, the data demonstrate that adding an intensified process in the upstream seed train could provide significant improvements to titer without sacrificing product quality.
Summary
The Cellicon® filter and controller enabled seamless adoption of a perfused N-1 seed train step into the cell expansion process. This approach could be used to reduce process steps, efficiently utilize volume and facility space, and reduce risk while keeping product quality standards high. When used in combination with a high-seed production process, the intensified expansion steps could also help to achieve greater productivity in the upstream process.
Related Products
To continue reading please sign in or create an account.
Don't Have An Account?