qPCR

Quantitative Real-Time PCR (qPCR) uses fluorescent reporter molecules to allow quantification of amplified products. As in conventional PCR, a DNA, cDNA, or RNA template is amplified, but at each cycle, fluorescent signals are monitored for relative or absolute quantification.
This technique is useful for numerous areas of research including gene expression analysis, genotyping, microRNA analysis, genetic variation analysis, and protein analysis.
Featured Categories
Polymerase Chain Reaction (PCR) is a mainstay in molecular biology labs. PCR is used for amplifying DNA by several orders of magnitude and our reagents and resources are suitable for numerous research workflows including, gene expression analysis, genotyping, sequencing, and mutagenesis application needs.
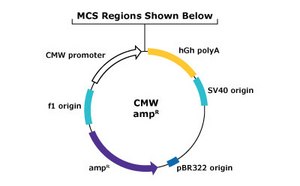
Molecular cloning and protein expression methods and protocols for reliable cloning and robust protein expression from insect, bacteria, and mammalian protein expression vectors.
Epigenetic reagents and resources for investigating RNA species, DNA methylation, chromatin modifications, and histone modifications.
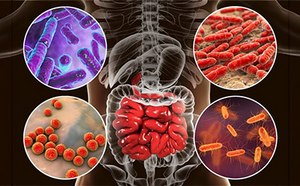
Comprehensive Gut Microbiome Analysis: Uncover a holistic solution encompassing sample prep, sequencing, bioinformatics, and statistics. From 16S to WGS.
How to Analyze qPCR Data
The fluorescence of the reporter molecules is measured and quantified; typically these are either dyes (i.e. SYBR® Green, Ethidium Bromide) that intercalate between the bases in double-stranded DNA, or probes designed to bind a specific sequence (i.e. Molecular Beacons, TaqMan® probes) on the DNA.
Relative Quantitation of qPCR Data
There are two major quantification methods for qPCR data. Relative quantification, the more common method, uses ΔΔCt information, by which the expression or abundance ratio of the target gene in the sample is determined, compared to a control gene, and normalized with the expression ratio of a reference gene. Since, the efficiency E values for target and reference genes differ, this method also accounts for the differences in E values. This method is more frequently employed in gene expression analysis.
Absolute Quantitation of qPCR Data
The second method, absolute quantification, is more common in environmental microbiology and makes use of the standard-curve (SC). The SC method uses dilution series of known template concentration, N0, to create a standard curve using the linear regression of log(N0) versus the CT (threshold cycle). This is then used to calculate template concentrations of the sample. The basis of this method is that the efficiency value of the sample is the same as that of the standard.
Looking for More Specific Information?
Visit our document search for data sheets, certificates and technical documentation.
Related Articles
- After a traditional PCR has been completed, the PCR/qPCR data analysis is conducted by resolution through an agarose gel or, more recently, through a capillary.
- Real-time polymerase chain reaction allows researchers to estimate the quantity of starting material in a sample. It has a much wider dynamic range of analysis than conventional PCR
- PCR assay guide navigates you through primer validation and other assay optimization factors to ensure high sensitivity and specificity for optimum DNA/ RNA quantification.
- PCR workflow's variability influenced by sample source, reverse transcription, and assay design, impacting reproducibility.
- See All (35)
Related Protocols
- Our SYBR Green qPCR Protocol is a method designed to detect accurate quantification of gene expression and RT-PCR reactions
- Chromatin Immunoprecipitation qPCR for studying gene regulation across conditions.
- Primer Concentration Optimization Protocol creates reaction matrix for testing primer concentrations against various partners.
- Optimization of qPCR conditions is important for the development of a robust assay. The two main approaches are optimization of primer concentration and/or annealing temperatures.
- Multiplex qPCR employing probe-based chemistries is a demanding application that often requires extensive optimization and validation.
- See All (28)
Find More Articles and Protocols
How Can We Help
In case of any questions, please submit a customer support request
or talk to our customer service team:
Email custserv@sial.com
or call +1 (800) 244-1173
Additional Support
- Calculators & Apps
Web Toolbox - science research tools and resources for analytical chemistry, life science, chemical synthesis and materials science.
- Customer Support Request
Customer support including help with orders, products, accounts, and website technical issues.
- FAQ
Explore our Frequently Asked Questions for answers to commonly asked questions about our products and services.
To continue reading please sign in or create an account.
Don't Have An Account?