PCR Assay Optimization and Validation
A Technical Guide to PCR Technologies
On This Page
- Optimizing PCR Conditions
- Validating Primer Design
- Optimizing Probe Concentration
- Optimizing Reaction Components and Multiplex Assays
- Optimizing Mg2+ Concentration
- Probe Fluorophore and Quencher Selection
- Guidelines for Optimization of Quantitative Reverse Transcription PCR (RT-qPCR)
- Assay Evaluation
Optimizing PCR Conditions
Assay optimization and validation are essential, even when using assays that have been predesigned and commercially obtained. Optimization is required to ensure that the assay is as sensitive as is required and that it is specific to the target of interest. For example, pathogen detection or expression profiling of rare mRNAs require high sensitivity; SNP detection requires high specificity and viral quantification needs both high specificity and sensitivity. Assays requiring high specificity are particularly vulnerable when performed without optimization and adequate controls. Similarly, when multiple targets are to be detected simultaneously in multiplex reactions, assay conditions must be optimized to detect all targets equally. Validation provides the data required to justify the continued use of the assay in further research projects1.
There are a number of factors that can be altered to obtain optimum assay performance and thereby lead to higher molecular sensitivity, specificity and precision. Assays purchased from skilled commercial providers still require validation within the laboratory in which they are being used. Claims relating to the performance of assays should be verified under the conditions of the study, including test samples, specific reagents and the instrument of choice.
An assay that has been designed such that all desirable design criteria were met (PCR/qPCR/dPCR Assay Design) is likely to perform well under a wide range of conditions. However, all assays have a set of optimal conditions and these are dependent on the instrument, selected reagents (buffer conditions), primer concentration and/or annealing temperature (Ta), magnesium concentration and even ramp rate. Since it is usual to run the assay on a selected instrument and under standard buffer conditions, most optimization procedures are focussed on modification of primer binding kinetics using primer concentration or annealing temperature (Ta)/melting temperature (Tm).
Regardless of whether the target is DNA (qPCR) or RNA (RT-qPCR), the following preliminary steps will help ensure successful quantification:
- Validating Primer Design
- Optimizing Primer Concentrations
- Optimizing Primer Annealing Temperature
- Optimizing Probe Concentration
- Optimizing Reaction Components and Multiplex Conditions
- Validating Performance with a Standard Curve and Melt Curve Analysis
Validating Primer Design
Validation of primer design is particularly important when adopting primers from a previous publication or using a commercially supplied assay. The primer design can be reviewed with respect to the assay design guidance provided in PCR/qPCR/dPCR Assay Design. It is critical to ensure that:
- Primers are homologous to the desired target sequence.
- The reverse complement primer is correct. Carefully check reverse complement base orders (using http://www.bioinformatics.org/sms/rev_comp.html).
- Appropriate splice variants are detected.
- SNPs have been avoided unless required for the assay.
- The oligos and amplicon do not adopt a secondary structure.
- There is low potential for the oligos of the reaction to hybridize to each other.
Primer dimer
The ability of primers to hybridize to one another, especially at the 3’-end, may lead to primer extension during PCR and the formation of target-independent products, known as primer dimers. Whenever primer dimer products are produced and amplified, they divert reaction components away from synthesis of the desired product, thereby reducing assay efficiency and sensitivity. Therefore, primer dimers are an issue in reactions using both probe-based and SYBR Green I dye-based detection. With dye-based detection such as SYBR Green I, primer dimers also affect assay specificity because the nonspecific DNA-binding dye will bind to the primers and be detected along with the desired product. Therefore, primers that are likely to form primer dimers should be avoided.
Primer dimer prediction
To determine the potential for primer-dimer formation, use primer design software to analyze duplex formation. OligoArchitect provides details of the strength of self-dimer and cross dimer hybridization (Figure 9.1). Any 3’-terminal dimers formed by either the primer hybridizing with itself or with its partner, must be very weak (ΔG ≥ –2.0 kcal, Figure 9.1).
How can you reduce primer dimer?
Any primer with both a terminal ΔG < –2.0 kcal and an extendable 3’-end (5’-overlap) should be avoided. The strongest overall dimer should be unstable (ΔG ≥ –6.0 kcal). To avoid strong 3’-terminal dimers while maintaining specificity, choose primers that have 2 G or C residues in the last 5 bases, 1 G or C in the last 3 bases and an A or T at the 3’-end (Figure 9.1).
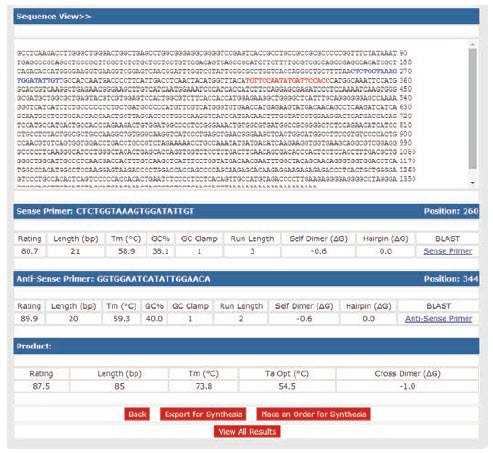
Figure 9.1.Analysis of primers for primer-dimer potential. Primer sequences were analyzed with OligoArchitect design software to determine their ability to form duplexes. A self dimer and cross dimer potential is shown for the best primer option. Multiplex qPCR will give the best results if all primers in the reaction have similar melting temperatures (Tm difference ≤ 2 °C) and do not form strong 3’-duplexes (ΔG ≥ –2.0 kcal).
Optimizing Primer Concentrations and Annealing Temperature (Ta)
When optimizing assay conditions using primer concentration, a fixed Ta (usually 60 °C) is selected and the optimal conditions for each primer are addressed independently. This is critical when designing an assay to be run in multiplex, since all reactions must run at the same annealing temperature, and is a tactic that can also be used to rescue poorly performing assays for which an alternative design is unavailable. A technically simpler approach is to select a fixed primer concentration and then optimize the Ta selecting the best result for those primers in combination. This is the preferred approach when using several assays and dsDNA-binding dye detection, such as SYBR® Green I. However, this approach does require an instrument that can simultaneously run reaction programs utilizing different Ta options.
Optimizing Primer Concentrations
When using probe-based qPCR, satisfactory results are often obtained using final concentrations of both primers at 500 nM and the probe at 250 nM, especially if the PCR target is abundant and maximum sensitivity is not required. Somewhat lower primer concentrations, between 200 nM and 400 nM, are typically better when using SYBR Green I dye-based detection to minimize nonspecific amplification and when optimizing multiplex reactions. To verify that standard conditions are suitable for use, conduct a standard curve analysis (see Assay Evaluation). If the detection is linear, reproducible and the gradient is between –3.2 and –3.5 over the range of target concentrations expected in samples, it may not be necessary to optimize primer and probe concentrations further.
Some of the indications that an assay is not well-optimized are; that it lacks reproducibility between replicates and is generally inefficient and insensitive. Assay performance is usually tested at a range of primer concentrations, for example, from 50–800 nM, using each primer at each concentration (Figure 9.2; for a full protocol, see Appendix A, Protocols; Primer Optimization).
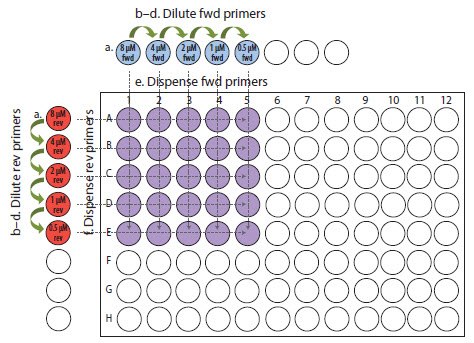
Figure 9.2.Primer optimization example. Layout of 8-tube strips (top and left side) and PCR plate for diluting and dispensing primers.
The combination of concentrations yielding the lowest Cq, lowest variation in replicates and a negative NTC is chosen (Figure 9.3)2.
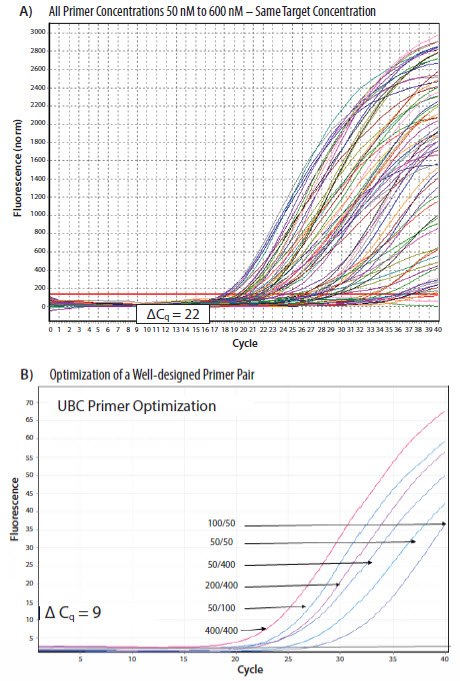
Figure 9.3.Results from a PCR primers concentration optimization from a SYBR Green I dye assay. A) Established guidelines recommend that a variety of forward (F) and reverse (R) primer concentrations are tested. In this example 50 nM to 600 nM was tested in combination to determine the optimal concentration for the assay. In this experiment, there is an enormous difference in Cq due to different primer concentrations, illustrating how this can impact the final data (data from Jens Stolte, EMBL). B) This experiment shows optimization of a well-designed assay and variability due to primer concentration. The 400 nM forward and reverse primer combination was chosen as optimal because this combination represented the lowest primer concentrations that reproducibly yielded the earliest Cq values while retaining a sigmoidal curve.
If one target in a multiplex reaction is significantly more abundant than the other(s) or if one primer pair yields a much lower Cq than the other(s), amplification of that target may dominate the reaction, using up reaction components before other targets are detectable. Adjusting the concentrations of primers may allow for a more balanced amplification of all targets. To determine if such adjustments will be beneficial, prepare standard curves (see Assay Evaluation) that cover the range of targets expected for each primer pair alone (singleplex) and with all primers combined (multiplex). If multiplex and singleplex reactions give similar results, the primer concentrations are suitable. On the other hand, optimizing primer concentrations is likely to improve results if the sensitivity is unacceptable in multiplex reactions. Decrease primer concentrations for those primer pairs that result in low Cq values and/or increase concentrations for those that yield high Cq values, within the range of 50–500 nM.
Optimizing Primer Annealing Temperature
Quantitative PCR assays are generally performed using two- or three-step temperature cycling programs, typically with 35–40 cycles. Two-step reactions cycle between two temperatures, usually 95 °C (typically for 10–15 sec) and 60 °C (typically for 30–60 sec or 5–10 sec under fast conditions). Two-step temperature reactions are selected when running Dual-Labeled Probe (TaqMan or hydrolysis) assays because the lower temperature elongation promotes exonuclease activity of the DNA polymerase and discourages displacement of the probe. This would be the favored cycling condition protocol for performing many different assays under the same parameters. However, the disadvantage of using the two-step method is that it reduces the potential options for primer design and limits assay optimization to primer concentration alone because no annealing temperature (Ta) optimization is possible.
A three-step cycling protocol is preferable when the target sequences are complex and either the chosen primers are difficult to optimize or the detection system in use is not dependent on the use of a hydrolysis probe. Three-step strategies cycle between: 95 °C (typically for 10 sec), an annealing temperature (between 55 °C and 65 °C, typically for 10–20 sec or 5 sec under fast conditions) and 72 °C (typically for 20–30 sec or 15–20 sec under fast conditions). In this case, the Ta may be optimized to further improve assay performance using the following protocol:
- Start at the low end of the Ta range to be tested, which is determined by the Ta of the primers, and increase the temperature stepwise in gradual increments (usually testing between 55 °C and 65 °C). Some instruments have gradient blocks that facilitate temperature optimization in a single run.
- Test each reaction product for specificity, either by post-PCR melt curve analysis or agarose gel electrophoresis, as described below.
- The optimal annealing temperature is the one that results in the lowest Cq, a negative NTC, a melt curve analysis revealing detection of a specific product and high reproducibility between replicate reactions.
If the annealing temperature is too low, the reaction will be nonspecific. However, if the temperature is too high, the stringency may affect reaction efficiency, resulting in a lack of amplification or very high Cq values, very poor yields and low reproducibility.
An example of a temperature optimization is shown in Figure 9.4. In this case (Figure 9.4A), identical reactions were run on a gradient PCR block such that the annealing temperature was between 47.8 °C and 71.7 °C. Annealing at 64.8 °C and 61.7 °C results in identical Cq values but the slightly lower temperature produces a higher yield of product, as evidenced by a higher end point fluorescence and a reaction with apparently higher efficiency (indicated by the gradient of the amplification plot). The absolute determination of efficiency requires a standard curve assessment (see Assay Evaluation) or use of single tube efficiency determination algorithms3,4. The second part of the figure (Figure 9.4B) shows a comparison between the behavior of primers under identical reaction conditions but in different reagent mixes. Here, it is clear that the buffer composition influences the reproducibility of the assay and the range of temperatures over which stable data is achieved. Finally, two independent assays were designed to the same target gene and these were optimized in each buffer. As is shown Figure 9.4C, each buffer required a different optimal temperature to yield comparable Cq data from the two primer pairs (61.7 °C in LuminoCt and 58.4 °C in KiCqStart).
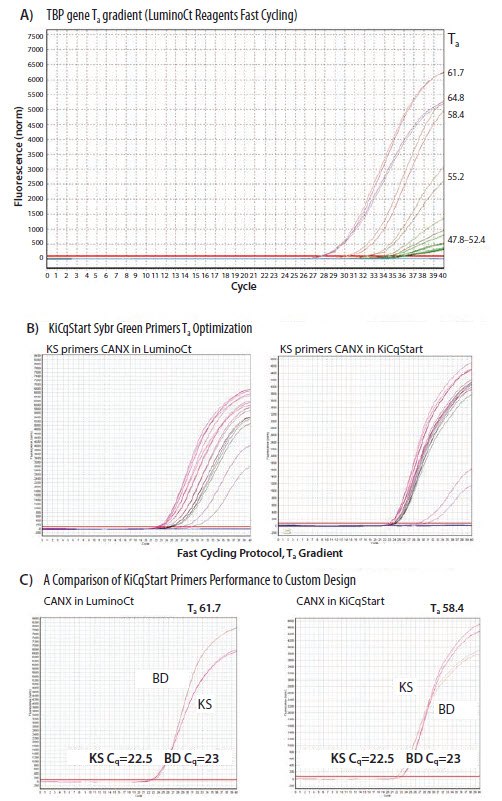
Figure 9.4.Primer optimization using Ta. A) A range of annealing temperatures was tested for identical reactions. Annealing at 64.8 °C and 61.7 °C results in identical Cq values and high reproducibility between replicates, but the slightly lower temperature produced a higher yield of product. B) Two identical reactions were set up in different reagent mixes (LuminoCt® SYBR® Green qPCR ReadyMix™or KiCqStart® SYBR® Green qPCR ReadyMix™) and a primer temperature gradient run. The optimal temperature differed in each mix and there was less variation between data when reactions were run in KiCqStart reagents. C) Two primer pairs to the same target (KS and designed using Beacon Designer, BD) were run in different reaction mixes. It can be seen that the optimal annealing temperature is different in the different reagents (61.7 °C in LuminoCt and 58.4 °C in KiCqStart) to yield similar results from the primers.
Although most commercial assays are supplied with standard PCR assay conditions, individual assays may benefit from further optimization to identify conditions that are specific for the particular primer combination. This may be due to primer dimers, nonspecific amplification, or sub-optimal reaction efficiency under the default conditions selected. Upon completion of optimization, assay efficiency should be calculated by applying the chosen conditions to the measurement of a series of standards and preparing a standard curve (Assay Evaluation). It is possible that, even after optimization, the efficiency may still be sub-optimal, and in the worst case scenario, a new assay may be required.
The range of tolerable efficiency values should be defined by the user prior to beginning the optimization process. Ideally, the efficiency should be >95%. However, it is possible to perform accurate measurements with assays which have efficiencies of <90% and, as with primer design, the target sequence may dictate that the target cannot be amplified with a higher efficiency. Nevertheless, when using an assay with a lower efficiency, it is likely that the precision and limit of detection will be affected. Under these circumstances, it is essential to use appropriate discretion when interpreting and reporting data1.
Optimizing Probe Concentration
A final concentration of 250 nM probe may be used for most assays. However, if maximum sensitivity is not required, lower concentrations of probe may suffice, thereby reducing the assay cost. To optimize the probe conditions, test it at several concentrations, ranging from 50 to 500 nM final, in combination with the optimized concentrations of primers and the lowest concentration of target nucleic acid that is expected to be included in the final experiments. The lowest concentration of probe that allows the most sensitive detection (Cq ≤ 30 with best reproducibility) may be used.
Optimizing Reaction Components and Multiplex Assays
There are some assays that are particularly sensitive to buffer/reaction conditions. For these assays further modification of reaction buffers by optimization of MgCl2 concentration, addition of PCR enhancers (Mueller in PCR Technologies; Current Innovations, 20135) or adjustment of instrument ramp rates can result in improved performance. In addition to the assay optimization guidelines provided in the previous sections, these factors are particularly important when optimizing multiplex reactions.
Optimizing Mg2+ Concentration
Magnesium plays several roles in PCR. It is a required divalent cationic counter-ion for dNTPs and a co-factor for all polymerases. Divalent cations strongly affect DNA double strand hybridization. Increasing magnesium concentration raises the stability, or melting temperature, of a DNA duplex. It follows that high magnesium levels increase the affinity of primers toward hybridization, including mis-priming events and primer-primer interactions. The mis-primed DNA duplexes become substrates for the DNA polymerase, in effect creating side products and sapping PCR efficiency. Therefore, the concentration of MgCl2 has an impact on both the specificity and yield of PCR because magnesium affects the hybridization of the primer to the target, the processivity of Taq DNA polymerase, as well as the rate of hydrolysis by the exonuclease moiety when used for probe cleavage in qPCR. Hence, insufficient MgCl2 results in poor yields due to low polymerization rate of DNA polymerase, compromised primer binding and inefficient probe cleavage. If the concentration of MgCl2 is too high, the specificity of the reaction will be compromised because this will lead to greater stability of nonspecific primer hybridization.
In contrast to conventional PCR assays which use 1.5–2 mM standard MgCl2 concentrations, hydrolysis probe qPCR assays require higher concentrations of around 3–5 mM to achieve efficient cleavage of the probe. The presence of MgCl2 also increases the rate of DNA hybridization, enabling efficient hybridization during the rapid cycling conditions used by many instruments. Optimization of MgCl2 concentrations becomes more important when running multiplex reactions.
Salts, such as KCl or (NH4)2SO4, will also change DNA duplex Tm, but the effect is less drastic for these monovalent cations.
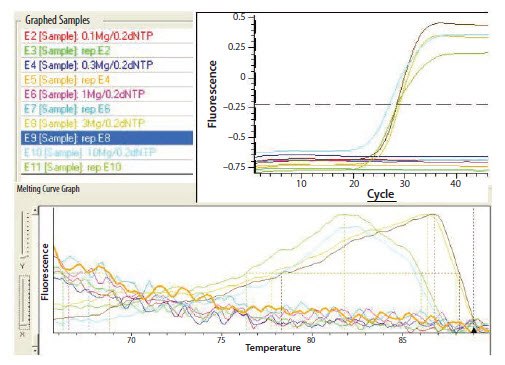
Figure 9.5.Effects of magnesium concentration.
The effects, shown in Figure 9.5, are magnified when performing multiplex PCR. Running multiple reactions concurrently introduces competition for reagents and exacerbates any sub-optimal conditions, creating major changes in PCR efficiency.
Ramp Rates
There are rare occasions when a difficult reaction requires further modification. When all other options have been exhausted, it may be possible to recover a lost situation by empirical testing and modification of the PCR ramp rate.
Probe Fluorophore and Quencher Selection
When running multiplex assays, it is also important to maximize the spectral separation of the multiple emissions from different fluorophores to facilitate signal isolation and data analysis. Therefore, fluorophores with narrow, wellresolved bandwidths that are widely separated are useful for multiplex applications. However, in reality the choice of fluorophore is restricted by the optical system of the instrument. Quantitative PCR and Digital PCR Detection Methods contains further information pertaining to selection of fluorophores and quenchers.
Guidelines for Optimization of Quantitative Reverse Transcription PCR (RT-qPCR)
When performing RT-qPCR, it is not only important to consider the guidelines for standard qPCR as discussed previously and optimize the RT as discussed in Reverse Transcription, but also to address the following points that are specific to the RT step:
- Verify RNA Quality (Sample Purification and Quality Assessment).
- Confirm that Primers Span or Flank Long Introns (PCR/qPCR/dPCR Assay Design).
- Optimize Reverse Transcription (Reverse Transcription).
- Verify No-Reverse Transcriptase (No-RT) Control Data.
Confirm that Primers Span or Flank Long Introns
While most gDNA is eliminated from the sample during RNA purification, no procedure removes all of the DNA. Since PCR is capable of amplifying a single molecule of DNA, contaminating DNA is amplified as well as RNA when using RT-qPCR. If the target mRNA is fairly abundant (hundreds or thousands of copies per cell), the resulting signal from contaminating amplification of DNA will be negligible in comparison to the products from the RNA; however, if the target mRNA is moderately abundant or rare (<100 copies/cell), signal arising from DNA amplification can lead to erroneously high estimates of mRNA levels. To avoid DNA amplification during RT-qPCR, where possible, use primers that either flank an intron that is not present in the mRNA sequence or that span an exon-exon junction (PCR/qPCR/dPCR Assay Design).
If the gene of interest does not contain introns, if the intron positions are unknown, or if there are no suitable primers that span or flank introns, it may be necessary to digest input RNA with an RNase-free or amplification-grade DNase I. The data from no-RT controls can be used to determine whether or not further digestion with DNase I is needed.
Verify No-reverse Transcriptase (No-RT) Control Data
Regardless of whether the primers span or flank introns, the specificity of RT-qPCR assays should be tested in control reactions that do not contain reverse transcriptase (no-RT control) to evaluate potential amplification from contaminating DNA. As described in PCR/qPCR/dPCR Assay Design, DNA sequences with short introns (≤1 kb) may be successfully amplified in RT-PCR. Many genes have additional copies, or pseudogenes, that lack one or more introns. As a result, the DNA contributions to resulting data from RT-PCR assays should be tested by performing a reaction that contains the RNA sample but no RT enzyme, alongside reactions containing both RNA and RT enzyme (Figure 9.6). DNA amplification is regarded as acceptable in qPCR if the Cq values for no-RT reactions are at least 5 cycles greater than those for reactions with RT6. However, if there are fewer than 5 cycles between Cq values for reactions with and without RT, DNA amplification may contribute to mRNA quantification.
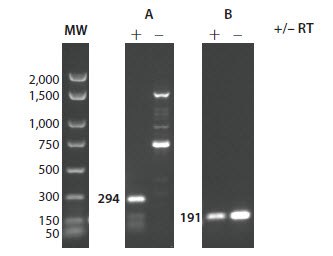
Figure 9.6. Evaluation of no-RT controls. RT-PCR products produced in the presence (+) or absence (–) of RT enzyme were fractionated on an ethidium bromide-stained 2% agarose gel in TBE. Primers for the mRNA target in A flank a 1 kb intron. The mRNA target in B aligns with several genes, at least one of which is a pseudogene that lacks the intron between the primers used for RT-PCR and, therefore, gives a product of the same size with and without RT enzyme.
When the DNA contamination of the RNA is contributing significant signal to the experiment, the RNA should be digested with an RNase-free or amplification-grade DNase I, before RT-qPCR to allow reliable mRNA quantification. Note that on-column DNase digestion (a procedure offered with many commercially available RNA purification kits in which a DNase digestion is performed while the RNA is bound to a silica column) is less effective at eliminating DNA than digestion in solution after eluting RNA from the column. As a result, on-column (OC) DNase digestion may not be sufficient for RT-qPCR (Figure 9.7). No-RT controls should be conducted with DNase-digested RNA to verify that the digestion was successful and sufficient. In the example shown in Figure 9.7, OC DNase digestion is sufficient to detect reliably the target mRNA. It would not be sufficient to quantify reliably a much less abundant mRNA if greater sensitivity was required.
Note that different types of cells and tissues, as well as different growth conditions, produce significantly different concentrations of specific mRNAs. In addition, different RNA purification methods yield different amounts of contaminating DNA. As a result, reactions with and without reverse transcription should be performed at least once with each new starting material, RNA preparation method, or assay.
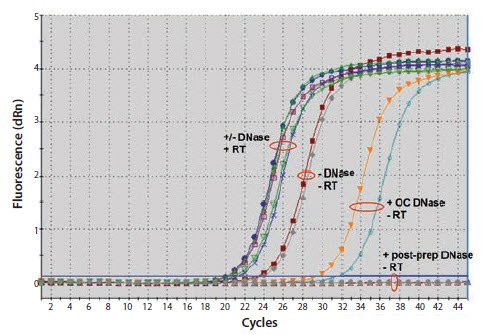
Figure 9.7.Comparison of on-column DNase digestion (OC) with post-preparation DNase digestion. Total RNA was prepared from 30 mg pieces of mouse liver with either our GenElute™ Total RNA Kit or a column purification procedure from an alternative supplier, both according to the manufacturers’ instructions. Two RNA samples were prepared with the respective manufacturer’s on-column DNase product and two were prepared without DNase digestion. After purification, aliquots of the four RNA samples prepared without on-column DNase were digested with our Amplification Grade DNase I according to the manufacturer’s instructions. Equal proportions of all were used in one-step RT-qPCR. Fluorescence plots for two of the RNA samples are shown. Similar results were obtained with both manufacturers’ products and only the procedure requiring the post purification DNAse treatment removed all gDNA.
Assay Evaluation
Once the assay has been optimized so that the most sensitive conditions have been identified, it is important to determine the assay specificity, efficiency and technical dynamic range.
Determine Specificity Using Melt Curve Analysis
Specificity can be determined by the use of a melt curve analysis. Performing a melt curve requires incorporation of a reporter dye such as SYBR Green I dye or the use of a nonhydrolyzing probe such as a Molecular Beacon or Scorpions® Probe (see Quantitative PCR and Digital PCR Detection Methods). After the amplicon is produced during qPCR, it is subjected to incubation at increasing temperatures, usually between 55 °C to 95 °C. However, the user should verify that the theoretical melt point of their amplicon falls within this range since this will be dependent upon the size and GC content. The experimental Tm will vary slightly between different runs and reagents, primarily due to variations in MgCl2 and other ion concentrations.
The change in fluorescence is determined and plotted as rate of change of fluorescence vs. temperature. Since SYBR Green I is a nonspecific dye that binds to any double-stranded DNA, it is important to verify that the qPCR produces only the desired product when using this detection chemistry. Melt, or dissociation, curve analysis can be used to determine the number and approximate size of the products. An assay with high specificity will result in a single melt peak at a high temperature in reactions containing only target with nothing, or very little, detected in the no-template controls (Figure 9.8A). If the melt curve has more than one major peak, as in Figures 9.8B and 9.8C, the identities of the products can be further investigated by resolving them on an ethidium bromide-stained agarose gel. As shown in Figures 9.8D and 9.8E, reactions B and C contain excessive amounts of primer-dimer or other nonspecific products. Lowering the primer concentrations will often reduce the amount of nonspecific products. If nonspecific products are still detected in significant amounts with low primer levels, it is best to redesign the primers.
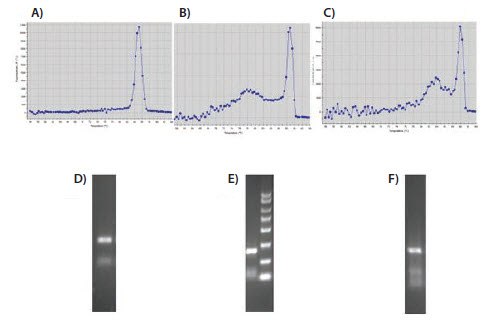
Figure 9.8.Evaluation of melt curves. Melt, or dissociation, curves showing a sharp peak of specific product at >80 °C with very little nonspecific product at lower temperatures (A) or significant amounts of nonspecific, lower melting product (B and C). D to F show PCR products from as shown on the melt curves A to C, respectively, resolved on ethidium bromide-stained 2% agarose gels.
An example of a melt curve analysis revealing gDNA and NTC primer-dimer contamination of RNA is shown in Figure 9.9. In Figure 9.9A, a specific product is evident from the test reactions and a smaller product, melting at lower temperature, is present in the NTC. This is indicative of the formation of primer-dimers in the absence of template. This is commonplace and is only a concern when these primerdimer products are evident in the test samples as shown in Figure 9.8. The example in Figure 9.9B shows detection of the unprocessed gDNA gene in a DNA sample using the same assay (in this case, primers were located in exons spanning the intron) that had also been used for mRNA detection. The products are distinguished by their melt profile with the gDNA product melting at a higher temperature because this also contains the intron.
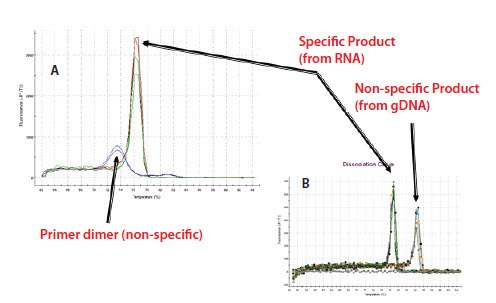
Figure 9.9.Example of a melt curve analysis A) primer dimers in no template control and B) the amplification across the intron of gDNA.
Specificity is critically important when designing assays for genotyping. These are often probe assays and require discrimination of a single base difference such as when differentiating between Single Nucleotide Polymorphisms (SNPs). In this case, it is critical to test each probe in a single reaction against a template that is known to contain the specific matched sequence and against the mismatched sequence.
Determination of Efficiency and Limit of Detection
The most effective means to measure assay performance is via the construction of a standard curve from a serial dilution of template. Assay efficiency can be measured as a factor of the standard curve gradient. A wide range of sample concentrations is run, ensuring that these reach a limiting dilution, thus allowing determination of the technical assay dynamic range from the same experiment.
Any suitable template material is appropriate for these technical determinations of assay performance. Selection of a standard, transferable reference material allows for inter- and intra-laboratory validation. Therefore, this stage of validation can be carried out on linearized or nicked plasmid (supercoiled DNA does not amplify efficiently and results in low reproducibility), cloned fragment or synthetic oligo. However, it must be recognized that validation on these targets is a measure of the assay function and does not accommodate variability introduced by the complexity of a biological sample.
The determination of the technical dynamic range and efficiency of an assay from a standard curve is illustrated in Figure 9.10. In this example, the template has been diluted through a 10-fold series of 11 logs and so a theoretical detection limit is demonstrated as 3 copies (lowest Cq), although the precision of this measurement is clearly determined by the reproducibility, which is relatively low at such high cycles.
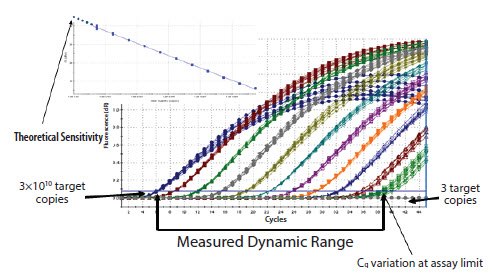
Figure 9.10.An example of high reproducibility and wide range of detection using a serial dilution of linearized plasmid. Eight replicates were run for each dilution and amplification of the target detected using SYBR Green I dye. Quantification is possible between 3×10¹⁰ and 3 copies.
Assay efficiency is determined by measurement of the gradient of a standard curve that is a plot of the log of the target concentration against the Cq (Figure 9.10). An assay with an efficiency of 100% would demonstrate doubling at each cycle (E=2) and a gradient of –3.323.
Efficiency can be calculated according to the equation:
Efficiency = 10(–1/slope) –1. Note: the software for many instruments provides an efficiency measure as a
percentage. This value is the percentage of E=2; therefore, an efficiency of 95% equates to E=1.9
The slope = m and is determined from the standard curve of equation y=mx+C.
C is the theoretical intercept on the y-axis and provides a relative measure of the sensitivity of the assay.
Slopes between –3.1 and –3.6 result in efficiencies between 90% and 110% and are typically accepted, but it is important to strive for as close to 100% as the assay will permit. The data presented in Figure 9.11 are illustrative of the normal range of variation in efficiency and sensitivity of a series of different assays. This serves to demonstrate how important it is to report these data in publications1,6-8.
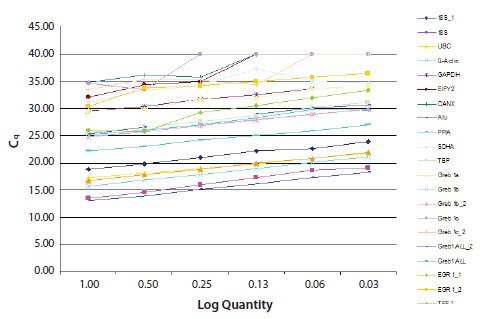
Figure 9.11.An example of efficiency determination and comparison of several, potential reference genes. As can be seen, these have very different efficiencies and sensitivities (data provided by students attending an Advanced qPCR workshop, EMBL).
Alternative approaches to standard curve efficiency calculation have been proposed. These methods report the efficiency of single reactions within the tube. These approaches rely on algorithms to model the amplification plot curves and so are dependent on the number of cycles over which there is an increase in fluorescence. These are most likely to succeed when the measurement is made using a DNA-binding dye or Scorpions® Probes since these assays yield a greater change in fluorescence per cycle. While this type of approach potentially offers an ideal alternative to standard curves, the latter is still the more common method used for assay evaluation. This is because standard curves not only provide an estimation of efficiency, but also provide additional information about working dynamic range, sensitivity and reproducibility and are conceptually easier to apply9.
The value of R2, or how well the data fit on the standard curve straight line, is a measure of reproducibility and is influenced by pipetting accuracy and by the dynamic range of the assay. Therefore, when assessing assays, it is critical to use a minimum of three technical replicates for each dilution. If R2 is ≤0.985, the assay may not give reliable results because reproducibility between replicates is poor. If one, or more, points at the lowest levels of input nucleic acid are shifted away from the linear region of the plot, it is likely that the measured concentration exceeds assay sensitivity. If one, or more, points at the highest copy number of input nucleic acid are shifted away from the linear region of the plot, it is likely that the reaction is saturated and that the concentration of target exceeds the useful assay range. Alternatively, if several random points are above or below the line, pipetting accuracy or assay optimization may be a problem. Verify that the tips fit the pipette properly and that the volume dispensed is reproducible and verify primer optimization as described above.
The standard curve is an essential tool for validation of multiplex reactions. Running multiple reactions concurrently introduces competition for reagents and exacerbates any nonoptimal conditions, creating major changes in PCR efficiency. Figure 9.12 demonstrates this point. The efficiency curves for two primer/probe targets were performed individually and then in multiplex. The graph shows that while the individual reactions (dark blue and green lines) give relatively similar efficiencies and sensitivities (y-axis values), running the reactions together dramatically changes the sensitivity and efficiency of the multiplex reaction.
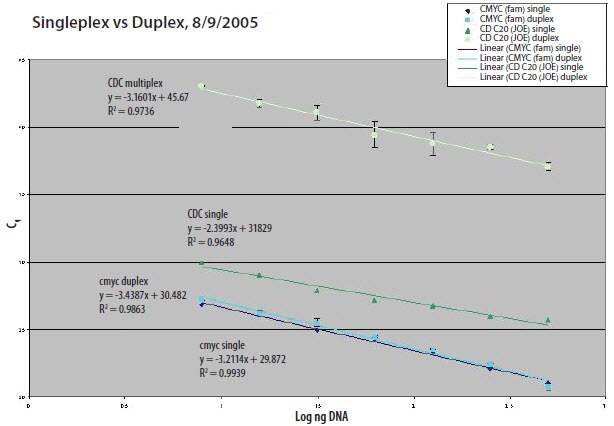
Figure 9.12.Singleplex Reaction vs Duplex Reaction.
Materials
References
To continue reading please sign in or create an account.
Don't Have An Account?