Untargeted Profiling of Glycyrrhiza glabra extract with comprehensive 2D-Liquid Chromatography-Mass Spectrometry
Francesco Cacciola1*, Katia Arena2, Paola Dugo3,4, Luigi Mondello3,4
1Department of Biomedical, Dental, Morphological and Functional Imaging Sciences, University of Messina, 98125 Messina, Italy
2Department of Chemical, Biological, Pharmaceutical and Environmental Sciences, University of Messina, 98168 Messina
3Chromaleont s.r.l., c/o Department of Chemical, Biological, Pharmaceutical and Environmental Sciences, University of Messina, 98168 Messina, Italy
4Department of Sciences and Technologies for Human and Environment, University Campus Bio-Medico of Rome, 00128 Rome, Italy
*Corresponding author
Overview of Sections:
Introduction
Plant metabolomics is the term coined for comprehensive, unbiased analyses of the full suite of metabolites expressed in a typical plant.1,2 In the last decade, the importance of metabolite profiling to functional genomics and systems biology has been critically evaluated, allowing a correlation of the expression pattern of genes with the accumulation pattern of the measured metabolites.3 However, plant “metabolomists” are still constrained by limited platform sensitivity and/or unavailability of a generic method to detect and identify the full suite of metabolites within given plant extracts/biological systems, i.e., limited metabolic coverage of the analytical method.4 The myriad chemically diverse metabolites that are present in the plant kingdom, estimated to be of the order of hundreds of thousands, which cannot be deduced simply from genetic data (unlike transcripts and proteins), further complicate the holistic task of achieving global detection of all metabolites.2,5 As a result, extension to metabolite profiling will be dependent on the advancement of classical methodologies (e.g., chromatography, mass spectrometry, and NMR techniques) to ameliorate the problem of limited metabolite coverage.4
The genus Glycyrrhiza, comprising of more than 28 species belonging to the Fabaceae family, is one of the oldest and most widely used herbal medicines in the world and is documented in various Asian and European pharmacopeias.6-9 The dried roots and rhizomes (normally referred to as licorice) of G. glabra, G. uralensis and G. inflate are extensively used to treat a wide range of medical conditions and illnesses, and these are regarded as major herb components in medicinal prescriptions.7,10 Clinically, licorice has been reported to exhibit a variety of pharmacological activities, including anti-cancer, anti-viral, anti-oxidative, anti-diabetic, anti-microbial, anti-inflammatory, and other forms of biological activities.11-18 Licorice flavors are also used in candies or as sweeteners, particularly in some European and Middle Eastern countries. Licorice consists of significant quantities of secondary compounds, particularly triterpene saponins, and phenolic compounds such as flavones, isoflavones, flavanones, and chalcones, which are responsible for the bioactivities of licorice.7,19 Hence, attention has been given to the secondary metabolites present in licorice which are associated with their broad spectrum of pharmacological effects and health benefits.19
The metabolic profiling of G. glabra is normally carried out either using high-performance liquid chromatography (HPLC) or ultra-high-performance LC (UHPLC) with photodiode array (PDA) and/or MS detection.10,19-21 However, the physiochemical diversity of secondary metabolites (e.g., polyphenols and saponins) having similar retention behavior tends to exceed the peak capacity of a single separation system. The heterogeneity of isobaric molecules also limits the identification based solely on MS data. Full profiling of chemically complex samples using LC-MS is rather difficult if not impossible.22 The emergence of comprehensive two-dimensional LC (LC×LC) that combines two separation mechanisms has provided an alternative platform for high-resolution analysis of complex real-world samples.23,24
In comparison with conventional 1D-LC, LC×LC provides higher resolving power (because of a multiplicative increase in peak capacity), in addition to structured chromatograms where components are spread out in 2D space according to the chemical specificity of retention patterns.25,26
The coupling of different separation mechanisms (e.g., hydrophobicity, polarity, size, and charge) to achieve a potentially “orthogonal” separation in LC×LC has some technical difficulties. For instance, a combination of the normal phase (NP) and reversed-phase (RP) can result in mobile phase immiscibility and lead to the precipitation of buffers or salts.25 Off-line LC×LC techniques which offered more simplicity have been frequently exploited. However, some disadvantages associated with off-line LC×LC techniques are longer analysis time, lack of automation, sample contamination, artifact formation, and software incompatibility issues. In this regard, several gradient methods (e.g., full-in fraction gradient, segment-in fraction gradient, shift gradient, etc.) have been exploited in recent years to mitigate such disadvantages, especially for RP-LC×RP-LC separations.27-29 Recent studies by Montero et al. demonstrated the applicability of a HILIC×RP combination for the analysis of food samples, which illustrated promising “orthogonal” separation of the phenolic compounds and saponins.30-32 Notably in references 31, 32 selected licorice samples were analyzed with the aim to provide a typical metabolite pattern according to their geographical location31 and further increase the HILIC×RP method performance.32
In this contribution, a systematic evaluation of RP-LC×RP-LC coupled with PDA and MS detection for the untargeted metabolic profiling of G. glabra extract is reported. The separation was conducted using a combination of the first-dimension (1D) microbore cyano column, and second-dimension (2D) superficially porous C18 column. Different 2D gradient modes were investigated to understand the separation behavior of different compound classes in RP-LC×RP-LC analysis. A new 2D gradient mode, namely multi-segmented shift gradients (MSG), was proposed for the first time here and was demonstrated to provide improved metabolite separation, resulting in a significant expansion of metabolic coverage.
Experimental Procedure
LC-MS grade ethanol, water, acetonitrile, and acetic acid were all received from Merck KGaA, Darmstadt, Germany. The G. glabra sample was provided by L'Oréal (India).
HPLC and LCxLC-MS Conditions
Separations were conducted on a Nexera-e liquid chromatograph system (Shimadzu, Kyoto, Japan) equipped with a CBM-20A controller, four LC-30AD dual-plunger parallel-flow pumps, a CTO-20AC column oven, a DGU-20A5R degasser, a DGU-20A3R degasser, a SIL-30AC autosampler, and an SPD-M30 PDA detector (1.8 µL detector flow cell volume) connected in series to an LCMS-8050 triple quadrupole MS, interfaced through an electrospray ionization (ESI) source. 1D-LC separations were performed on an Ascentis® Express C18 column (150×4.6 mm I.D., 2.7 µm dp). LC×LC separations were conducted by using a 1D Ascentis® Express ES-Cyano column (150×1.0 mm I.D., 2.7 µm dp) and a 2D Ascentis® Express C18 column (50×2.1 mm I.D., 2.7 µm dp). The employed mobile phases were 0.1% acetic acid in Water (A) and 0.1% acetic acid in Acetonitrile (B). The gradient for 1D was: 0-60 min, 35% B; 60 min, 80% B; 80 min, 100% B., with a mobile phase flow rate of 10 µL/min (maintained with the use of a lab-made flow-splitter; flowrate at pumps was 0.190 mL/min) and an injection volume of 5 µL.
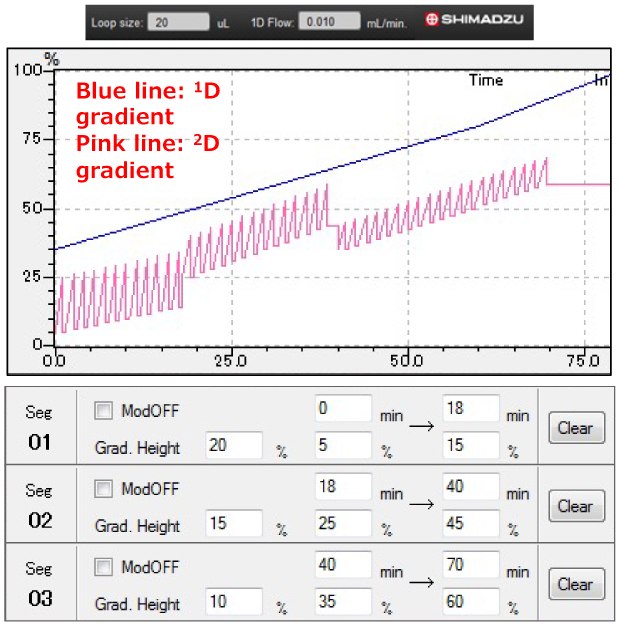
Figure 1.Multi-segmented shift gradient program
The 2D gradient program is shown in Figure 1. Modulation was performed at an oven temperature of 30 ˚C with a modulation period (i.e., switching valves) of 90 s. A schematic view of the system used here is shown in Figure 2. The ESI interface was operated in both positive and negative modes. The heater block temperature was 250 °C; the desolvation line temperature was 250 °C; the nebulizing gas flow was 2 L/min; the drying gas flow was 15 L/min, with an interface voltage of 3.5 kV and a detector voltage of 1.8 kV. A mass range of 100-1000 Da was used. The PDA detection wavelength was programmed to acquire a range of 210-400 nm, with a sampling rate of 12.5 Hz and a time constant of 0.08 s. 1D-LC experiments were conducted using the Ascentis® Express Cyano column configuration, except for the modulation process that was not performed. Shimadzu LabSolution software was used for modulation control, data acquisition, and processing.

Figure 2.Scheme of the instrument used for RP-LC×RPLC-PDA-MS analysis.
Data handling
Data acquisition and processing were performed using Shimadzu LabSolution™ software ver. 5.65 (Shimadzu, Kyoto, Japan). LC×LC-Assist software (ver. 2.00) was used for setting up the shift gradient and multi-segmented shift gradient analyses. Contour plots were generated using Chromsquare version 2.2 software (Chromaleont, Messina, Italy).
Results and Discussion
The analysis of G. glabra extract was first conducted using an LC-PDA-MS approach, employing the C18 column. Due to the high complexity of the sample, a considerable number of compounds overlapped (Figure 3), which is in agreement with earlier studies on licorice using a 1D-LC method.31,32 Therefore, a 1D-LC separation technique is likely insufficient for a comprehensive analysis of a complex plant extract, and the use of multiple dimensions (i.e., separation and detection selectivity) is necessary. In this regard, the metabolic products of the G. glabra extract were subjected to LC×LC-PDA-MS analysis to identify the full suite of compounds in the “metabolic pool” of biosynthesized metabolites.

Figure 3.1D-LC-PDA chromatogram of the licorice extract
Untargeted metabolomics study of G. glabra extract by RP-LC×RP-LC-PDA-MS
Preliminary experiences with similarly complex samples supported the choice of employing an RP-LC×RP-LC mode to effect appropriate separation within the 2D space.33 To obtain appropriate RP-LC×RP-LC separation performance, a low mobile phase flow rate is preferable in 1D, to allow minimum sampling volume to be transferred to 2D, in addition to more sampling ‘cuts’ across the 1D peaks. On the other hand, a fast separation is preferred in 2D to maximize the sampling (modulation) of the 1D eluate; too slow a 2D separation risks solute wrap-around phenomena. Hence, a microbore cyano column was chosen as 1D, and a superficially porous C18 column was used as 2D. In this instance, it is important to note that the 1D microbore column was operated at suboptimal chromatographic parameters, with a reduced 1D flow which allows a small 2D re-injection volume for better sample focusing. In this experiment, two high speed six port 2-position switching valves equipped with two, 20 µL sampling loops were selected for the RP-LC×RP-LC separations.34
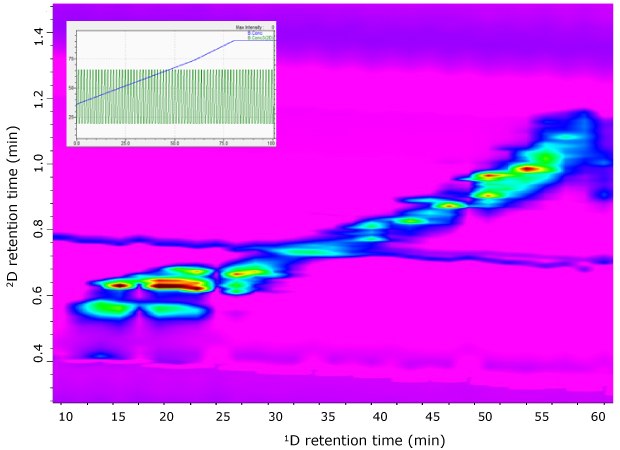
Figure 4.RP-LC×RP-LC-PDA contour plots of G. glabra extract analyzed using a full-in-fraction approach.
Fundamentally, the coupling of RP-LC×RP-LC provides limited resolving power (i.e., peak capacity) due to the apparent similarity of the separation mechanisms in both dimensions. A notable approach to mitigate this issue is the development or customization of 2D gradient elution selectivity, to improve the spreading of the solutes in the 2D separation space. To obtain an acceptable 2D separation, a conventional 2D full in-fraction (FIF) mode was initially investigated. In the FIF gradient approach, a constant gradient profile is implemented for the 2D separation; solutes that eluted early in 1D tend to be weakly retained in 2D while solutes that eluted late in the 1D tend to be strongly retained in 2D. Here, this resulted in the compounds being concentrated along the main diagonal line (Figure 4), indicating very little spread of the solutes over the 2D separation space.
In this instance, it is evident that the FIF gradient will have a limited peak-distribution area (> half of the separation space was not used) for this RP-LC×RP-LC mode. Fundamentally, the coupling of RP-LC×RP-LC provides limited resolving power (i.e., peak capacity) due to the apparent similarity of the separation mechanisms in both dimensions. A notable approach to mitigate this issue is the development or customization of 2D gradient elution selectivity, to improve the spreading of the solutes in the 2D separation space. To obtain an acceptable 2D separation, a conventional 2D full in-fraction (FIF) mode was initially investigated. In the FIF gradient approach, a constant gradient profile is implemented for the 2D separation; solutes that eluted early in 1D tend to be weakly retained in 2D while solutes that eluted late in the 1D tend to be strongly retained in 2D. Here, this resulted in the compounds being concentrated along the main diagonal line (Figure 4), indicating very little spread of the solutes over the 2D separation space. In this instance, it is evident that the FIF gradient will have a limited peak-distribution area (> half of the separation space was not used) for this RP-LC×RP-LC mode.
To improve the separation of the mixture, a 2D shift gradient (SG) approach utilizing a narrower range of organic solvent whilst gradually increasing the Acetonitrile proportion to create a progressively stronger 2D gradient (as the 1D gradient proceeded) was investigated. A multi-segmented SG (MSG) approach with three different SG steps was investigated. The first segment used a gradient steepness of 20% per modulation cycle, starting with 5% Acetonitrile and increasing to 25% Acetonitrile over 1 min; at 18 min, the gradient program in 2D started at 15% Acetonitrile and rose to 35% Acetonitrile. The second segment used a gradient steepness of 15% per modulation cycle, starting with 25% Acetonitrile and increasing to 40% Acetonitrile over 19 min; at 40 min, the gradient program in 2D started at 45% Acetonitrile and rose to 60% Acetonitrile. The third segment used a gradient steepness of 10% per modulation cycle, started with 35% Acetonitrile, and increased to 45% Acetonitrile over 36 min; at 70 min, the gradient program in 2D started at 60% Acetonitrile and rose to 70% Acetonitrile (Figure 1). It is noteworthy that the selection of gradient steepness is critical for effecting an appropriate separation and largely depends on the chemical properties of the solutes (i.e., retentiveness of the compounds in 2D).
For compounds that are retained stronger in 2D, a greater gradient steepness will be preferable to avoid wrap-around. On the other hand, for compounds that suffer considerable co-elutions, a lower gradient steepness will be advisable to allow stronger retention which results in better separation.
Demonstration of the multi-segmented gradient method
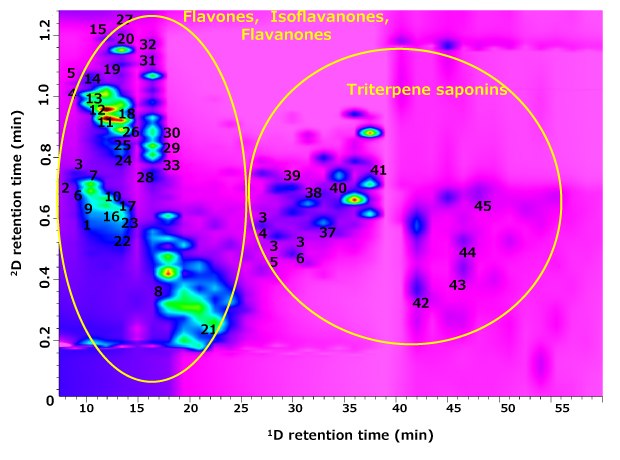
Figure 5.RP-LC×RP-LC-PDA analysis of G. glabra extract using the multi-segmented shift gradient approach. The numbering of compounds is according to Table 1.
The contour plot for the RP-LC×RP-LC analysis of G. glabra extract under the MSG program is shown in Figure 5. A visual inspection of the 2D plot shows a very promising peak spreading over the 2D separation space, with no evidence of distribution along the diagonal line (which might suggest correlated retention) in comparison with the observation of FIF, which might logically lead to overall improved compound coverage. The significant improvement of compound coverage can be justified by the precise segmentation of the 2D gradient profiles into three different sections, with each segment having a narrow organic solvent composition range and with different gradient steepness. This approach continuously shifts the gradient to higher Acetonitrile concentrations according to the chemical nature/class of the compounds, i.e., based on retentiveness in 2D.
Practically, there is no limitation on the number of segments that can be used to develop the MSG method. In the current example, the early eluting compounds (based on 1D elution) are weakly retained on the RP column, and so a narrower 2D SG program (segment 1), with Acetonitrile ranging from 5% to 15% (gradient steepness of 20% was used), which allowed the weakly retained compounds in the first column to be retained more strongly in the second column, resulting in better separation. For compounds that eluted later in 1D (implying stronger retention on the RP column), steeper shift gradients (segments 2 and 3) with lower gradient steepness were used to allow the stronger retained compounds to be efficiently eluted without significant loss in resolution. MSG also facilitates bandwidth suppression effects compared with the FIF gradient and the use of different organic solvent range at different segments reduced the occurrence of wrap-around.
Chromatographically, orthogonality measures allow for reliable metric-based assessment of the usage of the 2D separation spaces. The method employed for such a calculation uses a series of “asterix” equations based on the experimentally measured peak retention times, allowing evaluation of the peak spreading around four lines in the RP-LC×RP-LC plot.35 As expected, the MSG experiment indicated the highest orthogonality value (92%), in comparison with FIF (50%) experiments. To further evaluate the significant expansion of compound coverage using MSG, the total peak capacity of the RPLC×RPLC separation (1nc×2nc) was determined according to the method defined by Neue:36
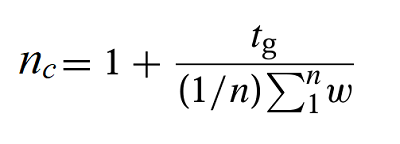
where tg is the gradient run time, n is the number of peaks selected for the calculation, and w is the average peak width of the selected peaks. Using this equation, the theoretical 1nc×2nc value, being multiplicative of the individual values obtained for the two dimensions, was calculated as 654 for FIF, and 1219 for MSG. To have a realistic 1nc×2nc value, the under-sampling effect was calculated and estimated as 1.26 for FIF and 1.61 for MSG considering the number of fractions effectively transferred from the 1D to the 2D (2D cycle time, 2tC = 1.5 min, average 1D peak width 1ω = 3.6 min for FIF, average 1D peak width 1ω = 2.2 min for MSG). The practical 1nc×2nc value accounting for under-sampling and orthogonality factors was 260 for FIF, and 695 for MSG.37 These data further support the significant enhancement of peak capacity (~2-fold greater) when operating RP-LC×RP-LC under the MSG mode. Hence, for this complex plant extract, the MSG method clearly shows a better and more powerful strategy for an effective separation of compounds with various polarities and/or complexity.
Interpretation of MSG analysis of G. glabra composition using RP-LC×RP-LC-MS/MS
Phyto-constituents in licorice extract were analyzed by using RP-LC×RP-LC-PDA-MS operated under the MSG approach, and according to the greater separation power realized for the 2D space, a total of ca. 120 compounds were detected. The major classes of compounds included flavanones, flavones, chalconoids, and triterpenes. Table 1 reports the tentative identification of the G. glabra constituents based on their MS and diode array spectra data with reference to the reported literature.31,32 The gain in compound coverage can be readily observed; 1D-LC analysis (Figure 2) enabled ca. 66 compounds to be detected, in comparison to RP-LC×RP-LC analysis indicating the detection of ca. 120 compounds (Figure 5), corresponding to a ca. two-fold increase in the number of detected components. The contour plot demonstrates that the compounds are organized mainly into two major structural clusters in the 2D separation space. The justification for this structural feature is the organized variation in the chemical structure of molecules of a particular class that leads to minor changes in the relative affinity with the stationary phases, in which the 2D gradient plays a major role in eluting the components at different solvent strengths, leading to small differences in retention position in 2D. Although the number of tentatively identified compounds is limited (due to the lack of authentic and reliable libraries of standards and specificity of spectra for isomeric components), the significant expansion of metabolite coverage is substantial, with respect to the number of peaks with higher purity, i.e., pure MS spectra are obtained (Figure 6). For instance, a selected chromatographic region of the licorice extract (Figure 6Bi and Bii) clearly illustrated that 1D-LC does not have sufficient peak capacity to reveal the full chemical profile of licorice metabolites, owing to the likely overlap of compounds. However, when RP-LC×RP-LC analysis was employed, specific differences were observed (Figure 6A); various isomers of iso(liqueritin) apioside were separated and tentatively identified by examination of the acquired MS spectra (Figure 6C). Minor constituents who otherwise overlap larger components in 1D-LC may still be well separated and characterized due to 2D separation, as highlighted in the case of isoviolantin (Figure 6Cii). These selected examples are only a subset of such closely eluting components that confound the metabolite profiling of a complex plant-derived extract. This observation supports the case that the better resolution of RP-LC×RP-LC (in the current example operated under 2D MSG mode) does indeed lead to a greater peak density in the chromatographic space, allowing a significant expansion of metabolite coverage.
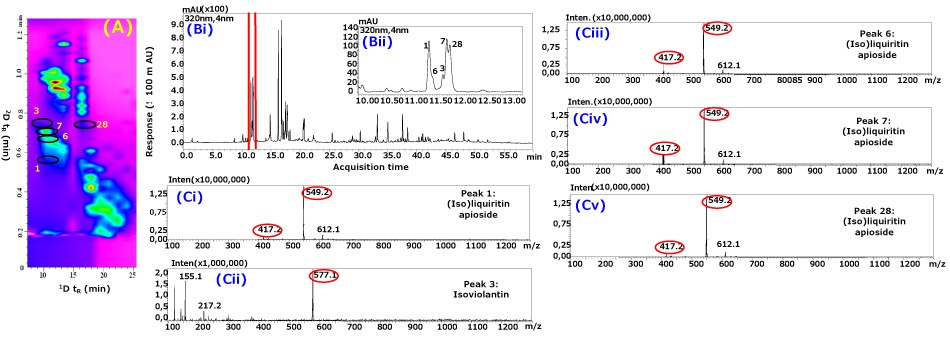
Figure 6.(A) Selected time interval (7.5 to 25 min) of contour plot showing the separation of peaks 1, 3, 6, 7, and 28; (Bi) 1D-LC chromatogram of licorice extract; (Bii) expansion of rectangle region in (Bi); Mass spectra with selected ion mass of (Ci) peak 1, (Cii) peak 3, (Ciii) peak 6, (Civ) peak 7, and (Cv) peak 28 using RP-LC×RP-LC-PDA-MS. The numbering of compounds is given in Table 1.
Conclusion
The prospects of employing MSG to expand the metabolic coverage in RP-LC×RP-LC-PDA-MS analysis of G. glabra extract are demonstrated. A combination of microbore cyano (1D) and superficially porous octadecyl silica (2D) phases provided a broad overview of the metabolite composition of G. glabra extract, with a focus on the flavones, isoflavanones, and triterpene saponins region and on the differentiation of isobaric components using two separation mechanisms. Both orthogonality and metabolic coverage are significantly enhanced by applying MSG for the 2D separation stage, allowing deeper characterization of the metabolic composition of G. glabra extract. A total of ca. 120 metabolites were detected, and 37 were tentatively identified and distributed mainly over the chemical families of flavanones, flavones, isoflavones, chalconoids, benzopyrones, and triterpenes. The spatial distributions of compounds in the 2D separation space provide knowledge about the nature of the compound chemical class, allowing more reliable identifications and facilitating the tentative assignment of chromatographic peaks to specific metabolites.
The described MSG approach can be adapted to high-resolution RP-LC×RP-LC metabolic analyses of other complex plant-derived extracts.
REFERENCES
如要继续阅读,请登录或创建帐户。
暂无帐户?