Tanaka Test for the Characterization of C18 Stationary Phase in HPLC Columns
Introduction
The properties of stationary phases, both physical and chemical, play a crucial role in the performance of HPLC. However, achieving reproducibility requires comprehensive chromatographic characterization. Consequently, prominent HPLC scientists have employed a range of approaches to assess selectivity. The Tanaka Test is widely recognized as the industry standard for evaluating column selectivity and performance.
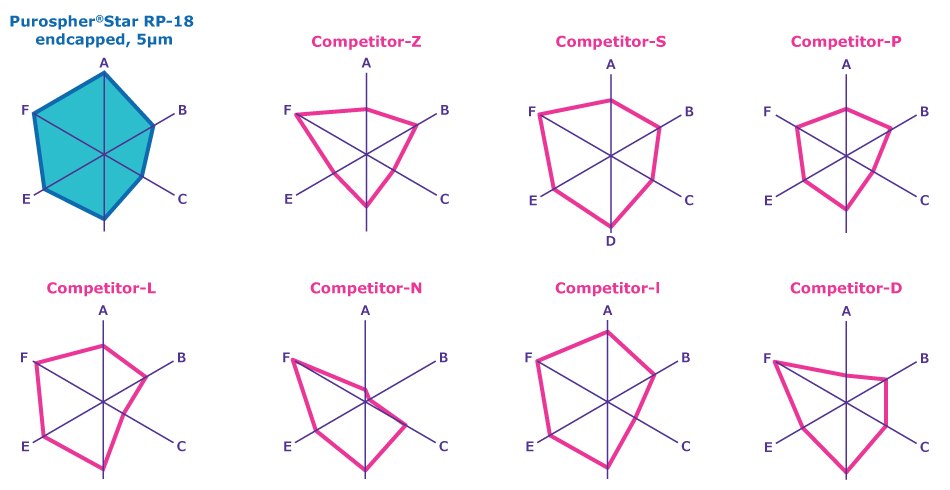
The test facilitates the comparison of HPLC columns and assists in choosing the most suitable column for specific separations by assessing essential parameters. Seven substances are utilized to assess capacity, hydrophobicity, steric selectivity, and silanophilic characteristics. The parameters are displayed on a hexagonal grid, offering a visual depiction of the sorbent’s characteristics. A hexagon that exhibits greater symmetry and a larger area indicates a more balanced stationary phase in terms of its chromatographic properties.
Results
In order to facilitate a clear comparison of the chromatographic properties of various phases, a hexagonal net diagram was implemented to visually depict the measured Tanaka parameters. To standardize the display, the measured values are multiplied by certain factors for this diagram. Table 5 contains the measured, un-modified values and the Figure 1 shows the Tanaka plots for the tested stationary phases, demonstrating their relative performance across the selected parameters.
The Purospher® STAR RP-18 endcapped column demonstrated superior selectivity across all critical parameters in a comparative analysis with other "high-purity" RP-18 endcapped columns, as illustrated in Figure 1. The Tanaka Test results showed that this column offers a balanced performance in terms of hydrophobicity, retention, steric selectivity, and silanol activity, making it a column of choice for a wide range of HPLC separations.

Figure 1.Six axes radar Tanaka plots for Purospher® STAR RP-18 endcapped column and seven competitor columns.
Conclusion
The Tanaka Test is an indispensable tool for chromatographic characterization, as it enables a comprehensive assessment of HPLC columns. The Purospher® STAR RP-18 endcapped column is a robust option for high-performance, reliable separations, with its balanced chromatographic properties confirmed through rigorous testing. By understanding the significance of each parameter assessed in the Tanaka Test, it is possible to make well-informed decisions regarding column selection for particular analytical requirements.
To continue reading please sign in or create an account.
Don't Have An Account?