跳转至内容
Merck
CN
HomeSmall Molecules Analysis & QCAssay of Betamethasone Sodium Phosphate by HPTLC

Assay and Identification of Betamethasone Sodium Phosphate by HPTLC

Dr. Ajay Kaparwan, Application Scientist, R&D

Abstract

This article introduces a highly efficient thin-layer chromatography (HPTLC) method for accurately measuring and identifying betamethasone, a glucocorticoid commonly used in different therapeutic applications. The method utilizes a Silica Gel 60 F254 HPTLC plate and involves two detection approaches, UV light at 254 nm and derivatization with 2,4-dihydroxybenzaldehyde. The method exhibits linearity across a concentration range of 1 to 7 µg/spot. The detection limit (LOD) and quantification limit (LOQ) were established as 0.91 µg/spot and 2.74 µg/spot, respectively. The method was validated with an assay range of 96.0 to 103%, confirming its suitability for quality control of betamethasone in pharmaceutical applications.

Section Overview
Introduction

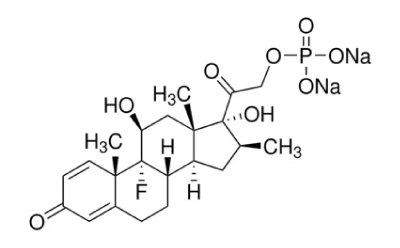
Chemical structure of Betamethasone sodium phosphate

Betamethasone sodium phosphate

Betamethasone Sodium Phosphate is the disodium salt of the 21-phosphate ester of betamethasone, a synthetic glucocorticoid with metabolic, immunosuppressive and anti-inflammatory actions.1

The European Pharmacopoeia monograph for betamethasone sodium phosphate employs high-performance thin layer chromatography (HPTLC) technique for the identification and spectrophotometric method for assay.2,3

Here we show a method for identification and assay of betamethasone sodium phosphate using 2 detection approaches and a densitometric measurement.
Experimental

Samples

Reference solution:

Dissolve 10 mg of betamethasone sodium phosphate CRS in 10 mL methanol.

Sample solution:

Weigh and crush 10 tablets of betamethasone sodium phosphate to a fine powder. Transfer an equivalent of 10 mg betamethasone of the powdered tablets to a 10 mL volumetric flask. Add methanol with intermittent swirling and sonicate for 5 mins before topping up to volume in methanol. Filter solution through 0.45 µm PVDF syringe filter.

Chromatographic Conditions

TLC plate:

Silica Gel 60 F254, 20 x 10 cm, HPTLC plate (1.05642)

Plate pretreatment:

Prewash the plate with methanol and dry at 120 °C for 30 min. Cool plate in desiccator before use.

Sample application:

5 μL

Auto spotter:

Camag Linomat 5 using band length = 4 mm, track distance = 20 mm, distance from left edge = 20 mm, distance from lower edge = 8 mm. Allow to dry completely before plate development.

Mobile phase:

Glacial acetic acid:water:butanol 20:20:60 (v:v:v) 

Development:

Unsaturated chamber for over 3/4 of the HPTLC plate. Dry in air after removal from chamber.

Detection and Derivatization:*

Detection A - Examine in UV light at 254 nm

Detection B - Weigh and transfer 0.25 g of 2,4-dihydroxybenzaldehyde into a 100 mL volumetric flask. Add 50 mL of glacial acetic acid to dissolve followed by 12.5 mL of sulfuric acid. Make up to mark with glacial acetic acid. Allow the solution to cool before use. Spray the HPTLC plate with this solution and heat plate at 90 °C for 35 min or until the spots appear. Allow the plate to cool and examine in day lightand under UV at 365 nm (viewing at 365 nm not done for this study)

Scanning Parameters:

Camag Scanner 4 in absorption mode, scan speed = 20 mm/s, slit = 3 x 0.2 mm, spectral recording = 200 to 380 nm;

Densitometry:

Measurements done at wavelength 254 nm.

* Ph. Eur. 10.0 described detection A&B, Ph. Eur. 11.0 describes only detection B.

Table 1.HPTLC conditions for identification and assay of betamethasone sodium phosphate

Results

Identification

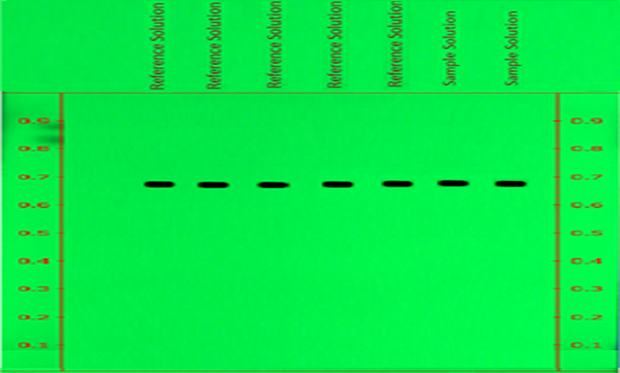
A thin-layer chromatography (TLC) plate, visualized under UV light at 254 nm, displays a vibrant green background. Both edges of the plate have 9 red markings from 0.1 to 0.9 cm at 0.1 cm intervals. A line is drawn across the top at the 1 cm mark, with tracks labeled above it. The plate shows seven distinct spots: five labeled as reference solution (from left to right) and the last two on the right labeled as sample solution. These spots are positioned just below the Rf value of 0.7 and stand out clearly against the green background.

Figure 1.Determination of Repeatability of betamethasone spots for reference solution and sample on chromatogram measured at wavelength 254nm (Detection A).
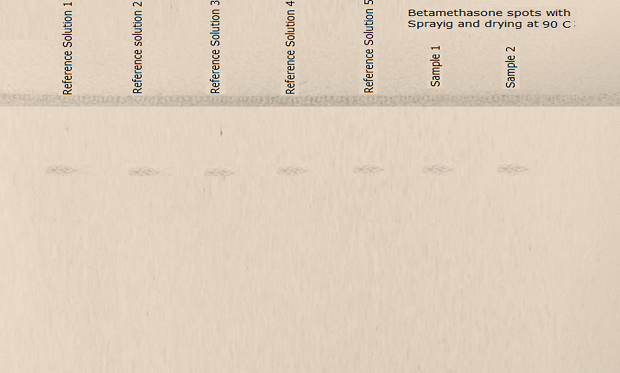
A thin-layer chromatography (TLC) plate, visualized under daylight after spraying with test solution, followed by drying at 90˚C, in buff color. A line is drawn at the top, with tracks labeled above it. The plate shows faintly colored seven distinct spots at same position: five labeled as reference solution 1, 2, 3, 4, and 5 respectively (from left to right) and the last two on the right labeled as sample solution 1 and 2.

Figure 2.The principal spot of reference and sample in the chromatogram obtained with the test solution in day light after derivatization (Detection B).

According to Ph. Eur. 11.0, the principal spot in the chromatogram obtained with the test solution should be similar in position, color, and size to the principal spot in the chromatogram obtained with the reference solution. (Figure 2).

Reproducibility
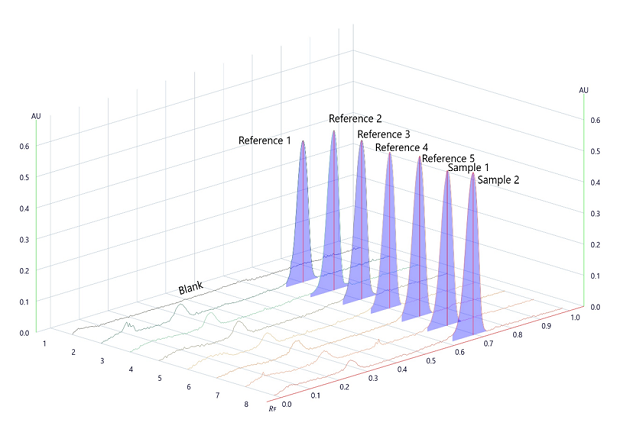
A 3-dimensional TLC-densitogram, obtained for the developed plate using a TLC analyzer and scanned at 254 nm. The x-axis on the flat rectangular surface shows the position of the tracks, ranging from 0 to 7, indicating where each compound starts on the plate. The y-axis displays the retention factor, ranging from 0.0 to 1.0 at intervals of 0.1. The z-axis represents the detector's response in absorbance units (AU), ranging from 0.0 to 0.5 at intervals of 0.1. Seven peaks rise from the flat rectangular surface, corresponding to the seven tracks spotted on the plate, labeled 1 to 7 from left to right. There are five peaks labeled as Reference 1 to 5 (from left to right) and the last two on the right labeled as sample 1 and 2.

Figure 3.Densitogram for Repeatability and Area under the peak measured at wavelength 254nm.

Reference Sol

Area under the peak

Retardation factor

Reference 1

0.02504

0.701

Reference 2

0.02466

0.709

Reference 3

0.02508

0.704

Reference 4

0.02447

0.701

Reference 5

0.02531

0.706

Mean

0.02491

0.704

Standard Deviation

0.00034

0.0034

% RSD

1.36

0.49

Table 2.System suitability and repeatability betamethasone reference solution repeatability (5 μg per spot) measured at 254 nm

Component

Observed Value

% RSD Area Under Peak

1.36%

% RSD Retardation Factor

0.49%

% Assay Betamethasone sodium phosphate (sample)

99.71%

Table 3.System suitability test results observed.

Assay for Betamethasone Sodium Phosphate by HPTLC

Linearity LOD and LOQ

Linearity of betamethasone sodium phosphate peak area measurements by densitometry at 254 nm for a calibration range of 1 to 7 µg/spot.
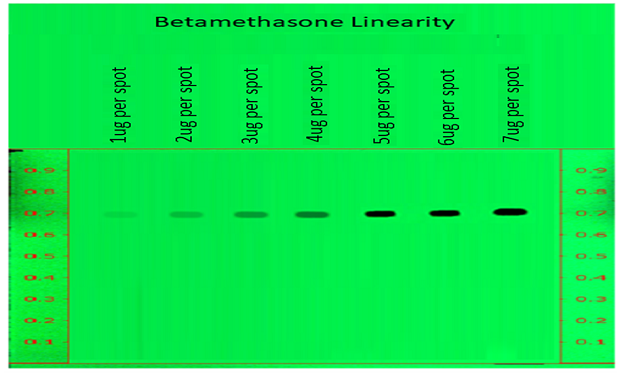
A thin-layer chromatography (TLC) plate, visualized under UV light at 254 nm, displays a vibrant green background. Both edges of the plate have 9 red markings from 0.1 to 0.9 cm at 0.1 cm intervals. A line is drawn across the top at the 1 cm mark, with tracks labeled above it. The plate shows seven distinct spots, with the spots becoming more intense from left to right, confirming the increase in the concentration of betamethasone. The seven labeled as 1 µg, 2 µg, 3 µg, 4 µg, 5 µg, 6 µg, and 7 µg (from left to right. These spots are positioned same, just below the Rf value of 0.7 and stand out clearly against the florescent green background.

Figure 4.Determination of Linearity of betamethasone sodium phosphate measured at wavelength 254nm.
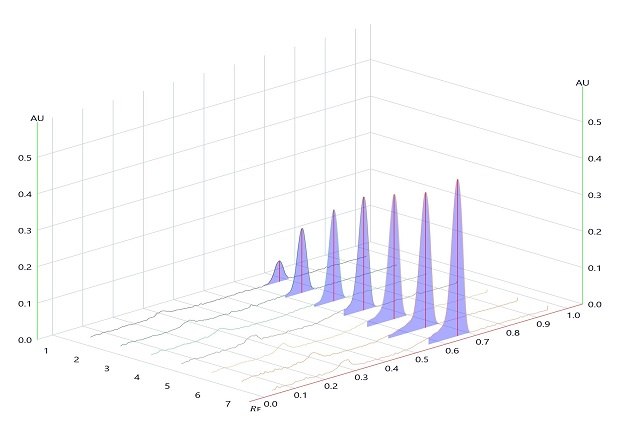
A 3-dimensional TLC-densitogram, obtained for the developed plate using a TLC analyzer and scanned at 254 nm. The x-axis on the flat rectangular surface shows the position of the tracks, ranging from 0 to 7, indicating where each compound starts on the plate. The y-axis displays the retention factor, ranging from 0.0 to 1.0 at intervals of 0.1. The z-axis represents the detector's response in absorbance units (AU), ranging from 0.0 to 0.5 at intervals of 0.1. Seven peaks rise from the flat rectangular surface, corresponding to the seven tracks spotted on the plate, labeled 1 to 7 from left to right. The peaks increase in height from track 1 to 7, indicating an increase in the concentration of betamethasone. All peaks are obtained at the same position just below the Rf value of 0.7.

Figure 5.Densitogram for Linearity of betamethasone sodium phosphate measured at wavelength 254 nm.
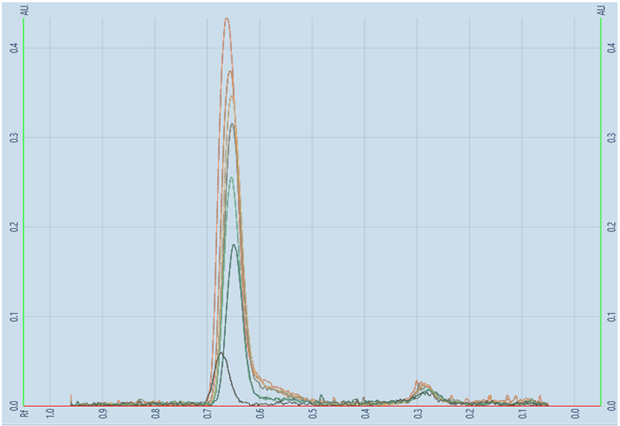
A TLC-densitogram, obtained for the developed plate using a TLC analyzer and scanned at 254 nm. The y-axis represents the detector response in absorbance units (AU) with major tick marks at 0.1, 0.2, 0.3, 0.4. The x-axis displays the retention factor, with major tick marks at intervals of 0.1, ranging from 0.0 to 1.0 (from right to left). It shows an overlay of peaks formed between Rf values of 0.7 and 0.6, of increasing heights obtained for the seven individual tracks.

Figure 6.Linearity scan of betamethasone sodium phosphate.
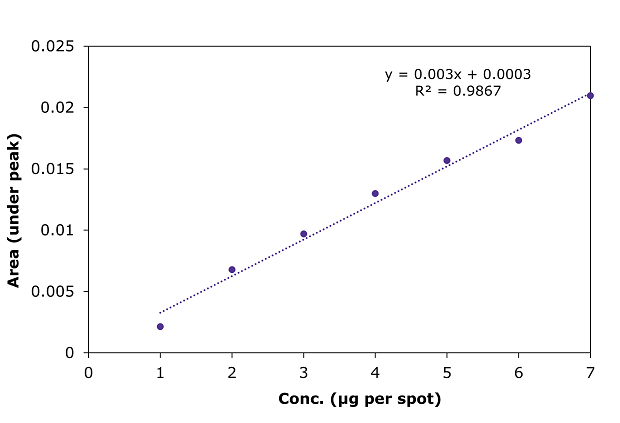
Linearity conc

(μg per spot)

Area under the peak

1

0.00214

2

0.00678

3

0.00969

4

0.01298

5

0.01569

6

0.01733

7

0.02096

Intercept

0.000287

Slope

0.002984

STYX

0.000819

R2

0.9867

LOD (μg per spot)

0.91

LOQ (μg per spot)

2.74

Table 4.Calibration data for betamethasone sodium phosphate measured at 254 nm
A calibration curve plot for betamathasone, scanned at 254 nm, shows Peak Area versus concentration (µg/spot). The x-axis has seven major ticks from 1 to 7 µg at intervals of 1 µg, representing concentration in µg. The y-axis, showing peak area, has five major ticks from 0.005 to 0.025 at intervals of 0.005. Seven data points are obtained in the range of 1 to 7 µ, with a blue colored straight dotted line passing closer to all the seven points (blue dots) as the best fit line. The line of best fit is represented by the equation ‘y = 0.003x + 0.0003,’ with a coefficient of determination (R²) of 0.9867.

Figure 7.Calibration curve for betamethasone sodium phosphate by HPTLC at 254 nm.

Accuracy and Recovery
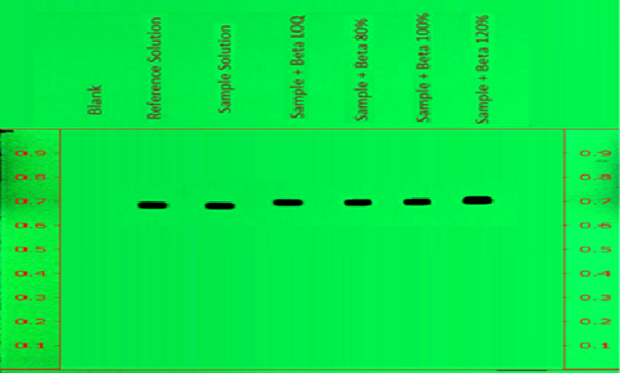
A thin-layer chromatography (TLC) plate, visualized under UV light at 254 nm, displays a vibrant green background. Both edges of the plate have 9 red markings from 0.1 to 0.9 cm at 0.1 cm intervals. A line is drawn across the top at the 1 cm mark, with tracks labeled above it. The plate shows six distinct spots, with intense spots appearing from tracks numbered 2 to 6 from left to right against the florescent green background. The first track is labeled “Blank” and doesn’t show any spot, the remaining tracks are labeled as Reference Solution, Sample solution, Sample + Beta LOQ, Sample + 80% Beta Spike," the sixth peak is labeled "Sample + 100% Beta Spike," and the seventh peak is labeled "Sample + Beta 120% Spike’’.

Figure 8.Determination of accuracy of betamethasone sodium phosphate with spiking over sample on chromatogram at measured wavelength 254nm.
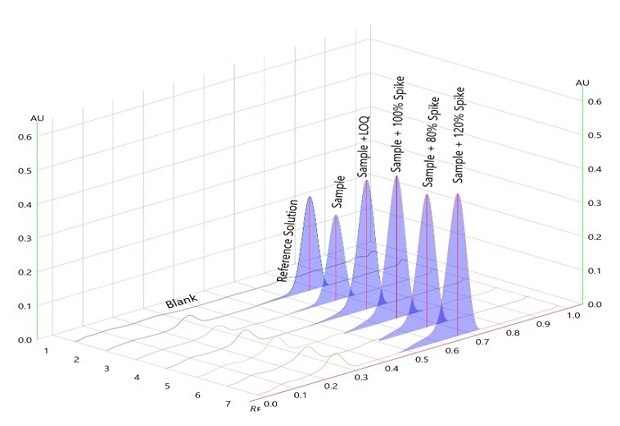
A 3-dimensional TLC-densitogram, obtained for the developed plate using a TLC analyzer and scanned at 254 nm. The x-axis on the flat rectangular surface shows the position of the tracks, ranging from 0 to 7, indicating where each compound starts on the plate. The y-axis displays the retention factor, ranging from 0.0 to 1.0 at intervals of 0.1. The z-axis represents the detector's response in absorbance units (AU), ranging from 0.0 to 0.6 at intervals of 0.1. Six peaks rise from the flat rectangular surface, corresponding to tracks 2 to 7, spotted on the plate from left to right. Track one, labeled "Blank," doesn’t show any peak. The second peak is labeled "Reference Solution," the third peak is labeled "Sample." The fourth peak is labeled "Sample + LOQ," the fifth peak is labeled "Sample + 80% Spike," the sixth peak is labeled "Sample + 100% Spike," and the seventh peak is labeled "Sample + 120% Spike’’.

Figure 9.Densitogram for accuracy of betamethasone sodium phosphate with spiking over sample on plate/chromatogram measured at wavelength 254nm.

No.

Spike Level

μg per spot Added

μg per spot Found

% Recovery

1

LOQ

2.8

2.84

101.4

2

80%

4.0

3.86

96.5

3

100%

5.0

5.22

104.4

4

120%

6.0

6.16

102.7

Table 5.Accuracy and recovery determination for betamethasone sodium phosphate spiked samples

Conclusion

The presented instrumental HPTLC method is simple, linear, and selective over a concentration range from 1 to 7 µg/spot. The RSD for repeatability of area under the curve and retardation factor is < 2%. The limit of detection (LOD) was 0.91 µg/spot, and the Limit of Quantification (LOQ) was 2.74 µg/spot. The percentage recovery of betamethasone ranged from 96.5 to 104.4%.

Related Products
产品编号产品名称说明价格
HLP301Normal Human Hepatic Stellate Cells; passage 1Single-Donor Cryopreserved Stellate cells isolated from human livers, high viability, and characterized by cell specific markers
HLP302Normal Human Hepatic Stellate Cells; passage 2Single-Donor Cryopreserved Stellate cells isolated from human livers, high viability, and characterized by cell specific markers
HLP400Normal Human Hepatic Kupffer CellsSingle-Donor Cryopreserved Kupffer cells isolated from human livers, high viability, and characterized by cell specific markers and response to LPS stimulation
HLP501Normal Human Intrahepatic Biliary Epithelial Cells (Cholangioctyes); passage 1Single-Donor Cryopreserved Cholangioctyes cells isolated from human livers, high viability, and characterized by cell specific markers
HLP502Normal Human Intrahepatic Biliary Epithelial Cells (Cholangioctyes); passage 2Single-Donor Cryopreserved Cholangioctyes cells isolated from human livers, high viability, and characterized by cell specific markers
HLP601Normal Human Sinusoidal Endothelial Cells; passage 1Single-Donor Cryopreserved Sinusoidal Endothelial cells isolated from human livers, high viability, and characterized by cell specific markers
HLP602Normal Human Sinusoidal Endothelial Cells; passage 2Single-Donor Cryopreserved Sinusoidal Endothelial cells isolated from human livers, high viability, and characterized by cell specific markers
08-115Collagen Type I, rat tail
D5796Dulbecco′s Modified Eagle′s Medium - high glucoseWith 4500 mg/L glucose, L-glutamine, and sodium bicarbonate, without sodium pyruvate, liquid, sterile-filtered, suitable for cell culture
ES009-MFetal Bovine SerumUS Origin, EmbryoMax ES Cell Qualified FBS, sterile-filtered, suitable for stem cell culture
A5955Antibiotic Antimycotic Solution (100×), Stabilizedwith 10,000 units penicillin, 10 mg streptomycin and 25 μg amphotericin B per mL, 0.1 μm filtered, BioReagent, suitable for cell culture

References

1.
Betamethasone Sodium Phosphate. Nih.gov. . [Internet]. PubChem.[updated 10 Jul 2024]. Available from: https://pubchem.ncbi.nlm.nih.gov/compound/Betamethasone-Sodium-Phosphate
2.
Betamethasone Sodium Phosphate. Monograph 01/2008:0810. 10.0, 1970 (expired). [Internet]. Eur. Pharmacopeia. Available from: https://www.edqm.eu/en/-/shutdown-of-european-pharmacopoeia-10th-edition
3.
Betamethasone Sodium Phosphate Monograph 07/2021:0810. 11.0, 2089. [Internet]. Eur. Pharmacopeia. Available from: https://pheur.edqm.eu/
登录以继续。

如要继续阅读,请登录或创建帐户。

暂无帐户?