Organic impurity profiling method for Valacyclovir using TLC and following the United States Pharmacopoeia
Dr Sanjay Poman
Navi Mumbai, India
Abstract
This work introduces an analytical technique utilizing thin-layer chromatography (TLC) to analyze the organic contaminants in Valacyclovir Hydrochloride, an antiviral drug, following the guidelines set by the United States Pharmacopeia (USP). The method identifies related compounds D, E, F, and G using 0.25 mm Silica Gel 60 F254 TLC plates. The testing results exhibit excellent recovery and precision, with impurity levels falling below the acceptable requirements set by the United States Pharmacopeia (USP).
Section Overview

Valacyclovir Hydrochloride
Valacyclovir is an antiviral drug. It shows the growth and spread of herpes virus to help the body fight the infection. Valacyclovir is used to treat infections caused by herpes viruses, including genital herpes, cold stores, and shingles (herpes zosters) in adults. It is also used to prevent cytomegalovirus following a kidney transplant in high-risk cases.1
The present study demonstrates the use of a thin layer chromatography (TLC) method (Table 1) for determination of valacyclovir organic impurities (related compounds D, E, G & F) according to the USP monograph method.2

Figure 1a.Chromatograms at short (254 nm) wavelength.

Figure 1b.Chromatograms at long (365 nm) wavelength.

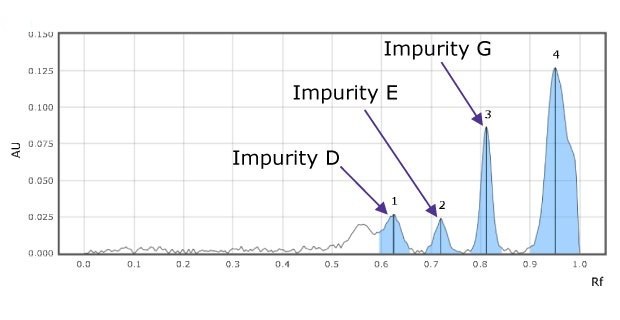
Figure 2a.Densitograms of impurity mix at 254 nm for impurity D (1), E(2), and G(3).

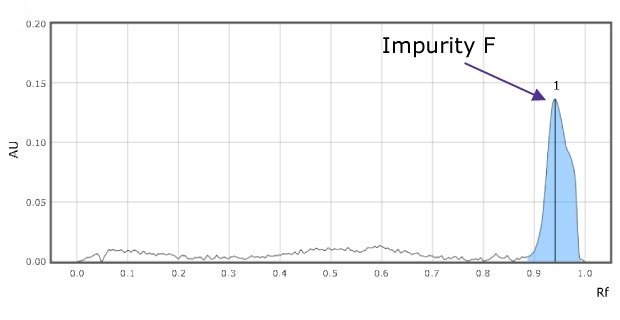
Figure 2b.Densitograms of impurity mix at 366 nm for impurity F (1) solution.

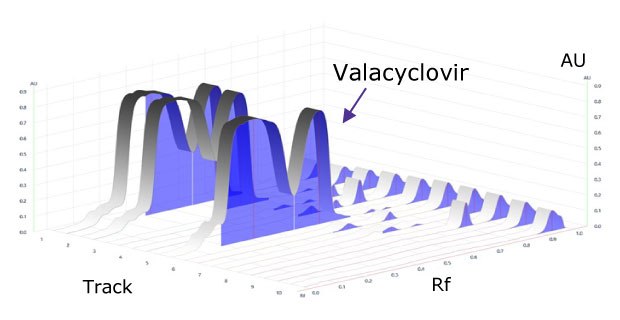
Figure 3.Densitogram of developed plate at 254 nm.
Conclusion
The chromatogram for the impurity mixes shows three clearly separated spots (Figure 1 & 2).
The relative Rf values of the standard spots are close to the relative Rf value mentioned in the USP monograph (Table 2) and the valacyclovir sample shows less amount of impurities E, G, & F than the acceptance criteria values mentioned in the monograph (Table 3).
See more applications for Pharmaceutical Analysis and Quality Control
References
To continue reading please sign in or create an account.
Don't Have An Account?