HUB Organoids® as Translational Models for KRAS Research
Despite clinical progress with KRAS inhibitors, especially for KRAS-G12C mutations, drug resistance remains a persistent barrier to long term patient benefit. Tumors often evolve under therapeutic pressure through mechanisms such as the acquisition of secondary KRAS mutations, pathway reactivation, or histologic transformation. For translational scientists in oncology, accurately modelling these resistance trajectories is essential for guiding rational combination strategies and the design of next-gen inhibitors.
Why choose organoids?
Patient-derived organoids (PDOs) offer a highly relevant preclinical model for studying acquired resistance in a patient-specific context. Unlike traditional cell lines or xenograft models, PDOs are never passaged in animals, preserving the genomic, transcriptomic, and phenotypic features of the original tumor. This minimizes culture-induced artifacts and allows for longitudinal tracking of tumor evolution under drug pressure. Additionally, the ability to generate organoids from tumor and matched non-tumor tissues supports simultaneous assessments of therapeutic efficacy and off-target toxicity.
HUB Organoids® built a large, annotated biobank of more than 50 KRAS-mutant PDOs across multiple tumor types, including colorectal, pancreatic, and lung cancers to support these efforts. This biobank includes models harboring G12C, G12D, G12V, G13D, and other clinically relevant KRAS mutations, enabling systematic evaluation of differential drug responses, resistance mechanisms, off-target toxicity, and biomarker discovery across the mutational spectrum.
Looking to use the HUB Organoids® biobank for your KRAS drug discovery program? Contact an expert now!
KRASmut PDO screen: A patient-derived organoid screening platform as a powerful tool to study the efficacy of KRAS inhibitors
KRASi efficacy can be evaluated using our preselected panel of KRAS mutant (KRASmut) PDOs using an ATP-based readout to measure organoid viability. The entire workflow from PDO thawing to data delivery can be carried out in 6 weeks for up to 24 PDOs and 7 compounds.
KRASmut PDO screen Wworkflow
PDOs are thawed
PDOs are expanded in ECM
PDOs are expanded in extracellular matrix (ECM) domes for 2-3 weeks.
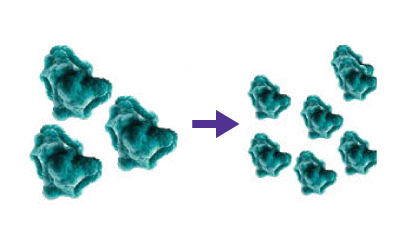
Day -2
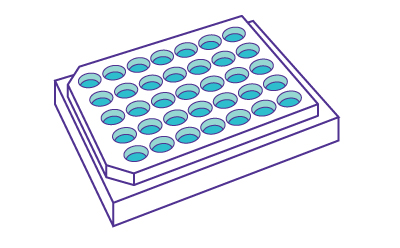
Organoids are then plated in suspension in 384-well plates.
Day -1
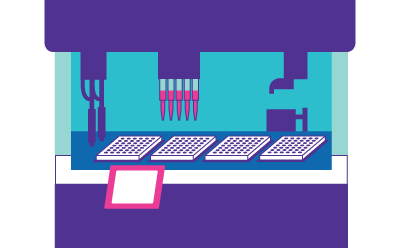
Compounds are added.
Day 0
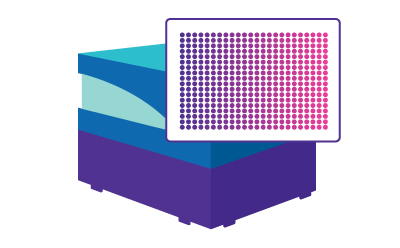
Viability is measured using an ATP-based readout after 6 days.
Day 6
Data is analyzed to generate Dose Response Curves and heatmaps.
KRASmut PDO Screen includes a panel of 24 PDOs representing clinically-relevant KRAS mutations. PDOs included in the KRASmut panel display various degrees of sensitivity to KRAS-G12C or G12D inhibitors highlighting the potential of the platform to support the identification of sensitive populations and prediction of clinical response (Figure 1).
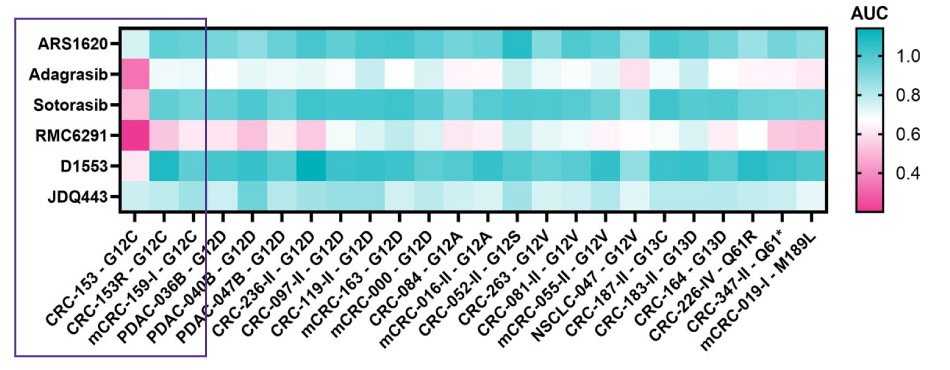
Figure 1.KRASmut PDOs display different sensitivity profiles to KRAS-G12C inhibitors. PDOs were exposed to 10 concentrations of various KRAS-G12C inhibitors for 6 days. Heatmap shows AUC of the resulting dose-response curves. Box highlights KRAS-G12C mutant PDOs
Our KRASmut PDO Screen is also set up to evaluate combinatorial treatments (Figure 2).
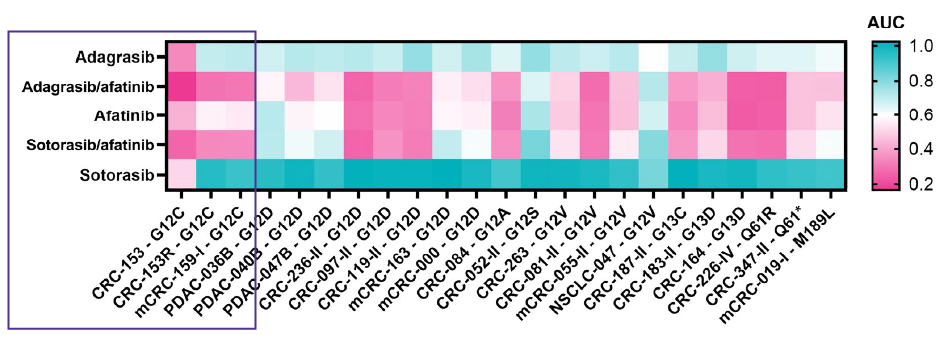
Figure 2.Evaluate combination treatments with KRASmut PDO Screen. An EGFR inhibitor (Afatinib) was tested in combination with approved KRAS-G12C inhibitors for its ability to synergize with their effect. Heatmap shows AUC of dose response curves of KRAS-G12C inhibitors Adagrasib and Sotorasib as monotherapy or in combination with Afatinib. Box highlights KRAS-G12C mutant PDOs
Leveraging our extensive biobank of CRC-derived PDOs, we systematically evaluated response to MRTX1133, a selective KRAS-G12D inhibitor currently in Phase I/II clinical trials for patients with pancreatic ductal adenocarcinoma (PDAC), across a diverse panel of models to simulate a real-world patient population (Figure 3). Through this study, we demonstrate the value of PDOs as translational models for exploring indication expansion, enabling early identification of responsive versus non-responsive patient subsets, and providing a rational framework for determining whether compounds designed for one tumor type may have therapeutic potential in others.
Our results revealed substantial functional heterogeneity. Some G12D-mutant CRC PDOs displayed partial sensitivity (e.g., CRC-P-00119-II), while others were non-responsive (e.g., CRC-P-00236-II), despite sharing the same mutation. Non-G12D KRAS-mutant organoids showed little to no response, consistent with the compound’s mutation-specific activity (Figure 3).
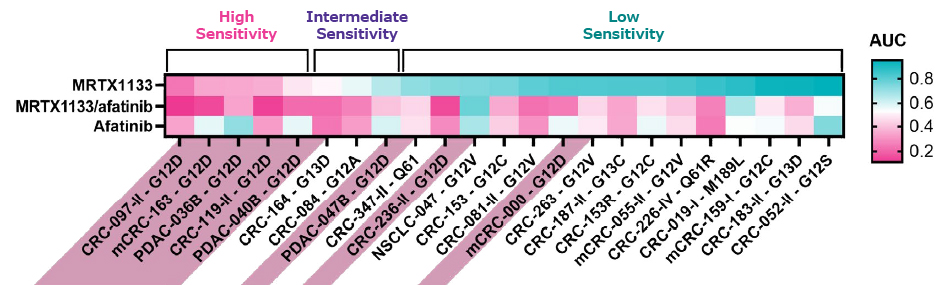
Figure 3.Evaluation of efficacy of a KRAS-G12D inhibitor as monotherapy or in combination with an EGFR inhibitor. A KRASmut panel including various clinically relevant mutations was exposed to 10 concentrations of the KRAS-G12D inhibitor MRTX1133 for 6 days. Heat map shows AUC of dose response curves of MRTX1133 as monotherapy and in combination with the EGFR inhibitor Afatinib. AUC are ranked based on response to MRTX1133 monotherapy. KRAS-G12D mutant PDOs are highlighted in pink.
Through our PDO-based viability screening platform, treatments that drive a response versus those that did not were clearly distinguished. To further stratify response and discover biomarkers that may inform treatment strategy, we applied multi-omics profiling, including single-cell RNA sequencing, which captures tumor heterogeneity, reveals resistant or sensitive subclones, and uncovers dynamic changes in response to therapy. Integrated with genomic, proteomic, and functional data, this approach supports the discovery of candidate biomarkers and pathways that guide therapy selection and the design of rational combinations.
How to model acquired resistance using patient-derived organoids
Understanding how cancer cells develop resistance to standard therapies requires examining the step-by-step progression towards complete resistance. Recent research shows that cancer cells can escape the effects of chemotherapy and targeted therapy by entering a reversible, slow-growing state called the drug-tolerant persister (DTP) state. This state allows them to survive treatment long enough to develop additional resistance mechanisms.
PDOs are a suitable platform for the study of the processes behind drug persistence and resistance, as they accurately mimic the cellular heterogeneity of the original tumor. To model the evolution of treatment resistance, we subjected our PDOs to a staged, iterative selection protocol.
Generation of persistent drug-tolerant PDOs method
Organoids were exposed to sub-cytotoxic concentrations of a KRAS inhibitor for approximately 5 days. This was followed by a drug washout period to allow regrowth in the absence of the drug to confirm the reversibility to the drug sensitivity.
Whole exome sequencing of PDOs
Parental, resistant and persistent PDO models were characterized using whole exome sequencing (WES), bulk RNA-sequencing, and single cell RNA-sequencing (scRNA-seq) to further stratify model response and for the discovery of biomarkers that may inform treatment strategy.
Our WES analysis was able to identify specific mutations in the resistant PDO population that are not present in the parental or regrowth PDOs, which indicates a potential role for the mutated gene in the development of treatment resistance (table below). Additionally, clear transcriptomic differences were observed between resistant, persistent, and parental PDO models (Figure 4A) that segregate in clusters suggestive of distinct transcriptomic profiles. Last but not least, bulk RNA-seq also highlighted the downregulation of drug transporter pumps, suggesting a possible mechanism for sustaining drug resistance (Figure 4B).
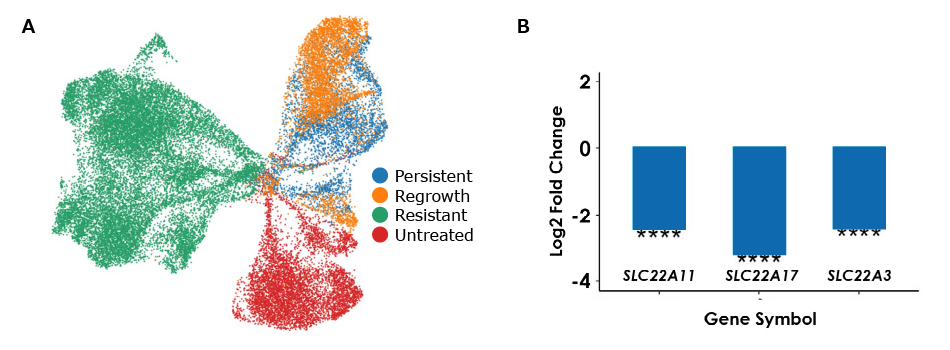
Figure 4.Characterization of the developed persistent and resistant PDO models, with comparison to parental (untreated) profiles. A) WES analysis revealed a pathogenic mutation in a target gene downstream the KRAS pathway exclusively in the resistant PDO model, not in regrowth or parental (untreated) models, explaining the resistance to Adagrasib. B) scRNA-seq demonstrated distinct clustering of resistant, persistent, regrowth, and untreated samples, highlighting differences in their transcriptomic profiles. C) Bulk RNA-seq indicated downregulation of drug transporter pumps, which are known to play a key role in drug resistance mechanisms.
Conclusion
Our HUB Organoids® biobanks provide a patient-relevant platform to test KRAS inhibitors, evaluate resistance, and guide therapy strategies. The biobank specified here of 50+ KRAS-mutant PDOs, including a preset 25 model panel across colorectal, lung, and pancreatic cancers, enables rapid, cost-effective screening or customized studies.
Related products